8 min read
Server acceptance with accelerators requires full load
Server acceptance with accelerators: test compute, memory, heat, throttling and links between cards, then document the results.
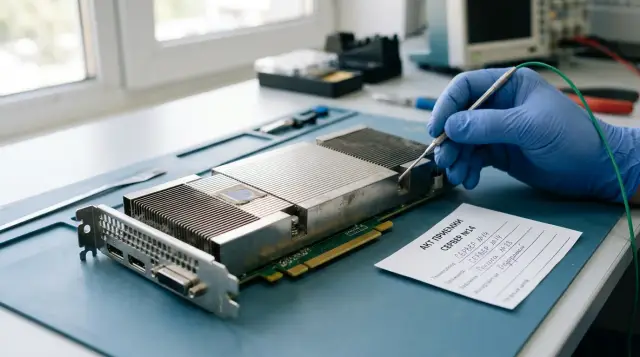
You cannot accept a server with accelerators from a component list and one short test. Acceptance must prove that every card can run the planned workload at the same time, memory transfers data at the expected rate, inter-card routes match the design, and cooling and power keep the result steady after warm-up. The main mistake an acceptance team makes is treating one high score as proof that the system works. A server can produce an attractive number in the first minute, then lower its clocks because of temperature or a power limit. One card can run quickly while the others sit idle. A test can pass over a slow PCIe route even though the design called for a direct accelerator link. The acceptance result therefore must be a reproducible package of raw data, time series, thresholds, and findings, not a simple "test passed" mark.
Agree on the criteria before powering on the server
Acceptance starts with a requirements matrix, not a random benchmark. The matrix ties each specification requirement to a test method, measured quantity, load duration, allowed deviation, and artifact for the report. Without it, the parties almost always argue after the test: the supplier presents the result from one card, the customer expects the total from eight, and the procurement document does not define the operating mode.
Record the server configuration: accelerator models and quantity, memory on each card, processors, system memory, drives, network adapters, power supplies, BIOS versions, and firmware. For the software side, record the OS, kernel, driver, compute environment, collective-communication library, and test version. Save the complete output of inventory commands, not just package names. A version number without launch parameters is not enough to repeat a measurement.
Do not take the expected value from an advertised peak. Theoretical tensor performance depends on the data type, sparsity mode, and allowed algorithms. The memory-bandwidth specification describes the silicon and memory on the card, not the code used by a particular test. The rate between two accelerators depends on interface generation, link width, hop count, and transfer direction. Choose one of three sources for each threshold: a mandatory value from the technical specification, an agreed result from a reference server with the same configuration, or a reproducible baseline run signed by both parties.
A useful criterion sets a lower bound and a spread. For example: "Each card maintains at least the agreed result after 20 minutes of warm-up, the difference between cards stays within the agreed percentage, and no compute or memory errors occur." The exact percentage depends on the platform and workload. A universal 90 or 95 percent sounds convenient, but proves nothing without a reference.
Separate mandatory and informational metrics. A mandatory criterion affects the committee's decision: a memory error, inactive link, failure to meet the agreed rate, or prohibited thermal limit leads to rejection or a repeat after repair. An informational metric describes the system but has no approved threshold. This distinction stops someone from turning an interesting metric into a rejection reason after the fact, or pushing a required metric into the notes.
Define the boundary of the system under test. Accelerators depend on CPUs, NUMA placement, system memory, PCIe, network cards, and power, so a "GPU test" often tests the entire node. If the purchase includes several identical servers, decide in advance whether every unit receives the full cycle or some checks use a sample. I would not accept sampled performance testing for an expensive multi-card system: moving a riser or cable makes each node a separate configuration.
Specify the room and rack conditions. Inlet-air temperature, closed panels, occupied neighboring rack units, and the fan profile affect the result. A server tested on a bench with the lid removed has not passed acceptance for a closed rack. Synchronize time before the test, free the accelerators from unrelated processes, and save the original power and clock settings. Changing a power limit to improve a score is acceptable only when the project specifies that mode and operations will use it.
Inventory catches faults before the load begins
Before applying load, confirm device identity, link state, and the absence of accumulated hardware errors. This is not paperwork: a card in the wrong slot, a narrower PCIe link, an unsuitable driver, or another active process can distort every later result.
For an NVIDIA system, collect a minimal state snapshot with:
nvidia-smi -L
nvidia-smi topo -m
nvidia-smi -q -d PCI,ECC,POWER,TEMPERATURE,CLOCK
dcgmi discovery -l
The first command maps each card index to a model and UUID. The topo -m matrix shows relationships between accelerators, CPUs, and network adapters. The detailed query records current and maximum PCIe width, ECC state, power limits, temperatures, and clocks. DCGM inventory provides an independent list of the entities visible to the diagnostic suite. AMD SMI and ROCm tools perform the same role for AMD, but pin fields and command names to the installed version instead of copying syntax from someone else's report.
Compare UUIDs and PCI addresses with the planned slot map. Indices 0, 1, and 2 can change after a firmware update or device move, so an index is not a permanent identifier. Tie results to the UUID, serial number when available, and bus address in the report.
Check the current link width and generation under load. Some platforms lower link speed at idle to save power, so a low idle value does not by itself prove a fault. If the link remains narrow during a transfer, investigate the slot, riser, BIOS settings, or distribution of CPU lanes.
Capture ECC and PCIe replay counters and kernel logs before and after each major stage. The difference between the snapshots matters. An old corrected error may belong to factory testing, while a counter increase during your load ties the event directly to the acceptance test. Do not clear counters before the first snapshot, or you will lose the delivered server's initial state.
A quick diagnostic confirms that the driver and libraries load, a context can be created, and the device is accessible. The NVIDIA DCGM manual explicitly separates readiness checks from active hardware tests: a skipped check means the health of that subsystem was not established, not that it is healthy. Store Pass, Fail, Warn, and Skip separately. Never turn Skip into a green mark.
Compute and memory need different workloads
One matrix test does not cover the whole accelerator: compute units, local memory, and transfer paths need separate loads. Start with the manufacturer's diagnostics, then run a measured compute test and a memory test using the data types required by the project.
In DCGM, the long suite includes compute diagnostics, local memory-bandwidth testing, targeted compute load, and targeted power load. The medium suite adds memory and PCIe tests to the quick software-environment check. The DCGM documentation describes diagnostics as active checks that need exclusive access to the cards. That restriction makes sense: an acceptance result must not depend on another job consuming memory or changing clocks.
A reproducible sequence for every available card looks like this:
dcgmi diag -r 2 -j > dcgm-medium.json
dcgmi diag -r targeted_stress -p targeted_stress.test_duration=1200 -j > dcgm-compute.json
dcgmi diag -r memory_bandwidth -p memory_bandwidth.is_allowed=True -j > dcgm-memory.json
Check the syntax against the installed dcgmi version before running it because parameter formats and plugin availability change. If a plugin is missing or a test returns Skip, that is neither a negative finding nor a successful check. The report must say "not tested," and the committee must select another supported tool.
A compute test must verify correctness, not only operations per second. The DCGM Diagnostic Plugin combines large matrix multiplications with writes and reads across frame-buffer regions while watching for XID events, uncorrectable memory errors, and temperature violations. Add a reference-result or checksum check to an application test. A fast but wrong matrix does not pass.
Load the data formats the project needs. A model-training server may depend on BF16 or FP16 and tensor units, scientific computation may require FP64, and inference may use FP8 or integer types. You cannot automatically apply an FP32 result to another mode. Beside the performance result, record the data type, matrix dimensions, library, sparsity mode, and whether reduced rounding is allowed.
Rule out a CPU-side bottleneck separately. The data generator must feed every card fast enough, and the process needs enough threads with correct memory placement. If accelerator utilization fluctuates, repeat the test with data prepared in memory and inspect CPU load first. An accelerator acceptance test should not accidentally measure slow storage reads unless storage belongs to that stage.
Inspect the result from each card even when the test prints only a total rate. A tool that distributes work unevenly can hide a disabled compute block or a card receiving fewer tasks. Utilization and power telemetry can expose the imbalance, but a test with per-device output is better. If that is impossible, run the same additional test on each card and include it beside the combined series.
The memory test must occupy a substantial share of available capacity and traverse different addresses rather than repeatedly reading a small cached buffer. Keep integrity and speed separate. Pattern writes followed by verification find cell and addressing errors; a streaming copy or triad measures bandwidth. You need both results because error-free memory can run slowly in the wrong clock mode, while a fast transfer does not prove error-free storage across the full capacity.
Load every accelerator at the same time
The server is accepted in its project configuration, so the main series must load every accelerator simultaneously. A sequential run on one card at a time helps locate a defect, but it does not test the shared power budget, airflow, CPU-root bandwidth, or collective operations.
First measure every card individually with the same command. This run exposes outliers: one card may lag because of a narrower link, a different power limit, or poor cooling contact. Then repeat the same test on all cards simultaneously. Compare the value for every card, not only the total. If the aggregate rises while one card falls after warm-up, the aggregate has hidden the problem.
Keep task dimensions and a sufficiently deep operation queue identical for the single-card and combined series. A matrix that is too small measures kernel launch and CPU work rather than settled accelerator throughput. A tiny dataset fits in cache and gives a false impression of memory performance. The size should keep the device busy and suit the tool, without causing disk swapping or an out-of-memory termination.
Choose duration by thermal stabilization, not by a neat round number. Two minutes can confirm that a test starts, but it is too short for a dense chassis with powerful passively cooled accelerators. Plot temperature and clock rate. When both curves reach a plateau, keep the load running for another agreed interval. For many servers, a 30-60 minute series reveals what a five-minute diagnostic misses, but justify the interval with the warm-up graph and project requirements.
After the main series, run several repeats after cooling and one repeat without a complete cool-down. The first set tests reproducibility from the same initial state. The hot repeat shows what happens when production jobs queue back to back. A dip that repeats only on a hot start still belongs to the server if that operating pattern can occur.
Do not run destructive or unsupported utilities merely because someone calls them a "burn-in." A safe acceptance test stays within normal firmware limits, does not change voltage, disable protection, or flash devices. Confirm the manufacturer's cooling and clearance requirements before a long load. The test should find a weak point, not create an operating mode forbidden by the documentation.
Temperature matters only with clocks and limit reasons
A temperature chart alone does not prove the absence of throttling. An accelerator may hold an acceptable temperature because control logic has already reduced its clock, or it may hit a power limit at a low temperature. Put core and memory temperature, compute and memory clocks, power draw, power limit, utilization, and clock-event reasons on one time axis.
The nvidia-smi manual distinguishes software power capping, software and hardware thermal slowdown, an external Power Brake signal, and other clock-event reasons. That detail is more useful than the general word "throttling." Power limiting at the configured limit can be normal for a compute workload if the server maintains the agreed performance. Hardware thermal slowdown or Power Brake requires investigation of cooling and power even when the average result still clears the threshold.
Collect a time series at one-second intervals, or at the fastest rate the monitoring tool supports without materially affecting the test. For NVIDIA, nvidia-smi dmon can record power, temperatures, utilization, clocks, violations, and errors. For AMD SMI, record the corresponding temperature, power, clock, and throttle-reason fields. Do not combine instantaneous and averaged readings without labeling them: the NVIDIA manual, for example, describes board power on supported devices as an average over the latest interval.
Read the shape of the curve. A healthy system generally warms up, settles into a stable state, and keeps performance close to that level. Sawtooth clocks paired with contact at a thermal limit point to cyclic limiting. A gradual clock decline as temperature rises shows too little thermal headroom. A simultaneous dip across all cards as power rises may indicate a shared power limit, while a dip on one card more often points to its cooling path, slot, or setting.
Take the temperature threshold from the specific model's documentation and device telemetry. You cannot declare one value for every card because modules expose different sensors and use different target temperatures. Some passive accelerators depend on chassis fans and may not report every reading type. Mark a missing field as unavailable instead of substituting zero.
After a failed result, repeat the test while checking airflow, filters, blanking panels, fan direction, and inlet temperature. Removing the lid is useful as a diagnostic experiment: if clocks recover, you have localized the chassis problem. It does not replace acceptance in the normal configuration.
The slot plan must match the real topology
Accept topology from the actual paths between devices, not from the number of installed cards. Two servers with identical accelerators can produce different collective-operation rates when cards attach to different PCIe root complexes, traffic crosses a CPU socket link, or a planned bridge fails to initialize.
First map physical slots and PCI addresses to nvidia-smi topo -m or the vendor equivalent. The matrix describes the relative route: a direct inter-card link, one or more PCIe bridges, a shared root complex, or a crossing over the CPU interface. It also shows proximity to network adapters and CPU affinity. That matters when a server receives data from a high-speed network directly into accelerators.
Next verify peer-access capability for every pair. The presence of two cards does not mean the application can transfer directly. The mode depends on hardware support, driver, virtualization settings, and IOMMU. If peer access is unavailable, data may travel through host memory, increasing latency and CPU load.
A topology label is not a measured rate. It describes the route but does not prove width, link state, or the absence of contention. A report containing only a topo -m snapshot is incomplete. Follow the diagram with a matrix of actual bandwidth and latency for every directed pair.
Test "accelerator to CPU memory" in both directions as well. Model loading and streaming processing depend on host-to-device and device-to-host transfers. Pin the process to the CPU node closest to the card, then repeat on the remote node. The difference measures the NUMA cost and helps confirm that the production service will use the correct binding. Do not average local and remote routes into one number.
If the specification promises a separate inter-card fabric, request the state of all its links and error counters. A direct route may exist while operating with fewer active lanes. The delivery diagram, telemetry, and measurement must agree here.
Measure inter-card links as a complete matrix
Measure bandwidth for every directed card pair and separately under concurrent transfers. Testing only cards 0 and 1 will miss an incorrectly installed fourth card, an asymmetric path, or contention from several transfers sharing one bridge.
The CUDA sample p2pBandwidthLatencyTest checks peer-access capability, bandwidth, and latency between GPU pairs. Its output consists of matrices whose rows and columns identify devices. Save the matrices with peer access enabled and disabled when the tool and platform allow it. The difference proves that the direct path is actually used rather than merely advertised by the driver.
For a server that will train models across several cards, add a collective test. NVIDIA's official NCCL Tests suite runs all_reduce_perf on a specified number of devices and prints message size, time, algorithm bandwidth, busbw, and error count. Its documentation explains that algbw and busbw are not interchangeable: busbw normalizes the result for the transfers required by a particular collective operation. Compare the same column, the same card count, and the same message size.
An eight-card single-server run can use:
./build/all_reduce_perf -b 8 -e 8G -f 2 -g 8 -n 50 -w 10
The size range shows where launch latency gives way to bandwidth, ten warm-up iterations remove the cold start, and fifty measured repeats provide enough data to assess spread. The card count must match the delivery. If the server has a different number, change -g and save the whole command in the report.
Do not judge small and large messages by one threshold. Launch latency dominates small messages, while links and the communication algorithm dominate large ones. Set acceptance thresholds at several representative sizes that match the workload. Distributed inference may use one range and large-model training another.
Run one pair at a time first, then several disjoint pairs, and finally a collective operation across all cards. If individual pairs are fast but concurrent traffic slows, you have found a shared resource: a bridge, root complex, inter-socket link, or fabric setting. That is why adding isolated pair scores is not enough.
Repeatability matters more than the best score
A healthy server produces a narrow, explainable spread after the same warm-up. The best score in a series is nearly useless for acceptance because it selects a lucky run and hides rare errors, background work, and thermal instability.
Keep every iteration, not just the average. Useful performance statistics include median, minimum, maximum, and a percentile from the lower part of the distribution. Fix the statistic before testing. If the technical specification defines a minimum, you cannot replace it with an average afterward.
Compare four views: one card against an identical card, cold start against hot start, isolated load against simultaneous load, and the first run against repeats. Each answers a different question. Card-to-card spread looks for a local defect, hot start tests cooling, the simultaneous series tests shared resources, and repeats expose instability.
Tie every outlier to telemetry and logs by time. A drop paired with a thermal limit points to cooling. A drop without a clock change but with increasing PCIe replay points to the I/O path. A pause across all cards alongside a kernel message may indicate a driver problem or device reset. Without synchronized clocks, this investigation becomes guesswork.
An average hides an uncommon but operationally significant risk. If one of fifty steps takes ten times longer, average throughput may still pass while a latency-sensitive service fails. For these workloads, retain the step-time distribution and upper latency percentiles. For batch computing where total hourly work matters, the lower bound of sustained throughput is usually more useful than a single maximum.
Automatic library tuning can also create differences. A first run may select an algorithm, create a cache, or compile kernels, so do not silently mix it with steady-state iterations. Separate warm-up from measurement and record the number of warm-up repeats. If a cache persists between series, either clear it with an approved procedure or explicitly treat it as the normal hot state.
Do not silently restart after a failure. Save the failed output, kernel logs, driver state, new error counters, and only then repeat. A successful retry does not erase the first event. Keep both results in the report and explain any repair if you changed a cable, slot, firmware, BIOS setting, or cooling component.
Is a small difference between identical cards acceptable? Yes, when it stays within a pre-agreed band, does not grow after warm-up, and has no connection to errors or limiting. Declaring every difference a defect makes no sense, but widening the band after one card has already scored low is worse.
An application test confirms suitability, not hardware health
Synthetic tests find faults and produce comparable numbers, but the final run should reproduce the shape of future work. It confirms that the chosen drivers, libraries, data type, batch dimensions, and distribution scheme work together.
Choose one stable job with fixed inputs and a known result. For training, this could be several hundred iterations of a model on a fixed dataset while checking loss, step time, and errors. For inference, record batch size, input length, accuracy, latency, and throughput. For engineering computation, retain the reference result and solve time. Avoid changing data or automatic parameter selection when it prevents an exact repeat.
Run the application test after diagnostics, not instead of them. If the model fails, earlier stages tell you where to look: memory, compute, links, or software environment. If the model succeeds, it still does not prove that patterns covered all memory addresses or that every card pair uses the designed route.
A container does not make a result reproducible by itself. Pin the image by immutable identifier, launch command, environment variables, visible devices, CPU and NUMA binding, mounted data, and resource limits. The latest tag is unsuitable for acceptance because it may point to another image tomorrow.
Do not update the driver between synthetic and application stages without repeating the earlier tests. A changed software environment creates a new test object. The same rule applies to BIOS, accelerator firmware, the collective-communication library, or a power profile.
For AI infrastructure projects, GSE.kz can connect server configuration, software-stack integration, and ongoing support, but acceptance thresholds still belong in the technical specification before delivery. Neither manufacturer nor integrator should have to guess which mode the customer considers normal.
The report must make every finding reproducible
A good acceptance report lets another engineer repeat the test without oral instructions. Terminal screenshots are poor evidence: they lose commands, lines, machine time, and original files. Save text and structured results, and include file checksums in the report.
For each stage, record the purpose, command, initial state, start and end times, inlet-air temperature, device identifiers, software versions, criterion, actual result, and decision. Point to the raw logs in the delivery archive. If a tool returns an exit code, save it as well.
A final register works well with seven fields: check ID, name, configuration, criterion, actual value, artifact name, and decision. For compute, include the data type, dimensions, and versions; for memory, add tested capacity and pattern; for thermal operation, retain maxima and the time series; for links, attach the pair matrix and busbw. A consistent row format makes completeness easier to review, while each criterion remains specific to its stage.
"Accepted with comments" needs a deadline, an owner, and an exact closure condition. "Performance is slightly low" is not usable. State which card, test, task size, expected and actual value, and temperature produced the deviation, then define the repeat that will confirm the fix.
The archive should include the original specification, inventory snapshots, planned and actual topology, launch commands or scripts, raw results, telemetry, system logs, repair information, and the signed outcome. Check that the files open on a separate machine and do not depend on the test engineer's shell history.
File names should map to a check ID and timestamp, not labels such as final2. State a checksum and time zone for large logs. Remove secrets, access tokens, and personal data before transferring the archive, but do not edit measurements by hand. If a log needs filtering, retain the filter script and the original in a protected part of the package so the committee can confirm provenance. The parties sign only after checking the archive contents because a final document without raw data cannot prove load duration or the state of individual cards.
Do not accept a server when a missing plugin prevented a test, only some cards produced results, telemetry ended before warm-up, or someone invented the threshold after measuring. Those cases mean "insufficient evidence." One extra run costs less than a performance dispute after the system enters production.
Frequently asked questions
How long should a GPU server run during acceptance testing?
Keep the load running until temperatures and clocks reach a plateau, then continue for another agreed interval. For a dense server, 30-60 minutes often reveals more than a short run, but base the decision on the warm-up graph and the platform's requirements.
Can a benchmark result alone support server acceptance?
No. A benchmark measures the speed of one operation but does not cover all memory, every card pair, bus errors, or stability after warm-up. You also need diagnostics, telemetry, link tests, and a reproducible application run.
What percentage of rated performance is acceptable?
There is no universal percentage because the advertised peak depends on data type and compute mode. Take the threshold from the technical specification or an agreed reference run on the same configuration and software versions.
Should every accelerator be loaded simultaneously?
Yes, the main acceptance series should use the entire delivered configuration. Only then do shared power, cooling, PCIe, and inter-card fabric limits appear; use individual runs for comparison and fault isolation.
Does a high temperature always mean throttling?
No. Inspect temperature, clock rate, performance, and the limit reason together. A card can run hot while maintaining its planned state, or run cooler because its clock has already been reduced.
How do you test bandwidth between GPUs?
For pairwise checks, use a vendor tool that produces a bandwidth and latency matrix, such as CUDA's `p2pBandwidthLatencyTest`. For collective operations, add NCCL Tests or the accelerator stack's equivalent and retain results for several message sizes.
What should I do when a diagnostic test returns Skip?
`Skip` means that test did not check the subsystem. Record the reason, install a supported component or select another tool; never count a skipped check as a pass.
Is variation between identical cards acceptable?
A small stable spread is acceptable when the band was agreed in advance and has no link to errors or clock limiting. A widening difference after warm-up or one persistent outlier calls for checks of the slot, power, and cooling.
Should the server be tested in the customer's container?
If production uses containers, run the final application test in the same immutable image. Separate hardware tests are still required because the container workload will not cover every memory address and communication route.
Which files belong with an acceptance report?
Include inventory, firmware and software versions, launch commands, raw results, telemetry, system logs, the topology matrix, and checksums. The final register must connect each criterion to the measured fact, artifact, and committee decision.