8 min read
How to measure PC power consumption before purchasing
Learn how to measure PC power consumption in standby, office work, and peak load, then calculate annual costs for 500 workstations.
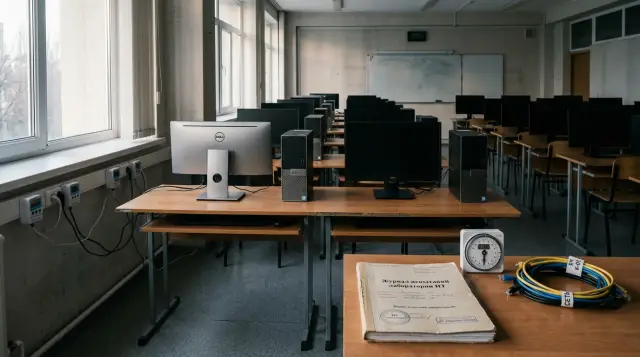
A power supply's rated wattage does not tell you how much electricity 500 workstations will use. A procurement decision needs a measurement at the wall, the same work scenario, and a calculation based on time spent in each mode. Without that, a powerful but efficient PC can look worse than a weaker one, while an all-in-one gets an undeserved advantage simply because nobody counted the desktop computer's monitor.
I would not make a decision from one "typical consumption" figure. It hides sleep settings, screen brightness, background updates, power supply losses, and the nature of the actual work. A sound protocol produces at least four results: off while connected to mains power, sleep, settled idle, average power under an office workload, and a separate short peak. You build an annual profile from these values, then multiply it by 500 devices, the tariff, and the service period.
Compare the complete workstation
You can compare an all-in-one and a desktop PC fairly only at the same measurement boundary: the workstation's wall outlet. For an all-in-one, that means its cable or external adapter. For a desktop set, the wattmeter must power both the system unit and the monitor included in the delivery. If you measure only the system unit, the comparison is meaningless because the all-in-one's screen is already part of its result.
Account for peripherals according to the procurement scope. An identical keyboard and mouse will barely change the difference between candidates, but you should still connect them if they draw power over USB. A dock, powered speakers, a second display, a card reader, and phone charging change the load more noticeably. Either include the same set on both benches or measure it on a separate line and do not attribute it to one computer.
Compare devices meant for the same role. You cannot put a midrange office all-in-one next to a desktop workstation with discrete graphics and twice the memory, then declare a winner by watts. First confirm that both configurations complete the required work at an acceptable speed. Energy is a useful criterion only among options that can do the job.
Write the exact boundary at the top of the protocol: "outlet -> meter -> unit under test." List everything powered after the meter in the same place. That line prevents the most common acceptance dispute, where the supplier presents consumption for a system unit while the buyer pays the bill for the whole desk.
For 500 seats, test several units of each final configuration rather than one random sample. One device can demonstrate the method, but it cannot reveal variation in components, firmware, and settings. If few preproduction units are available, record that limitation and repeat a shorter acceptance test on the delivered batch.
The test bench must measure energy
A procurement test needs a plug-in power analyzer that displays active power in watts and accumulated energy in watt-hours or kilowatt-hours. Current and voltage readings are not enough: simply multiplying volts by amperes produces apparent power, while an electricity meter bills active power. Switching power supplies have a power factor, so the error from that shortcut can be significant.
Choose an instrument with a suitable lower range. A device that reads hundreds of watts reliably may struggle to distinguish 0.7 W from 1.4 W in sleep. Standby testing needs resolution to tenths or hundredths of a watt, energy accumulation over an interval, and a known error at the lower end of the range. A calibration certificate matters more than an impressive sticker on the case, especially when the result will enter tender documents.
Complete four checks before the measurement series:
- Inspect the cable, outlet, and the meter's allowed load.
- Compare its clock or integration duration with an independent timer.
- Let the meter and computer reach room temperature.
- Check the reading with a stable load if the laboratory has a reference source.
IEC 62301 describes power measurement in standby and other inactive modes. The US Federal Energy Management Program's explanation of that method treats a mode as stable when variation stays below 5% of the five-minute mean; when consumption fluctuates, it recommends measuring energy over an interval and dividing by time. That principle works well for procurement outside a formal certification laboratory too: do not glance at a convenient instantaneous number, integrate an unstable load.
Display resolution is not accuracy. A meter that shows 0.01 W has not proved an error of 0.01 W. Record the meter model and serial number, its last calibration date, stated error, and range. When the difference between candidates is comparable to total uncertainty, the honest conclusion is "no confirmed difference," not a victory by one hundredth of a watt.
Record configuration and conditions before measuring
Power consumption changes with details that are easy to dismiss as noise: BIOS version, power plan, brightness, display refresh rate, wireless device battery state, antivirus activity, and unfinished updates. If you do not record them before testing, a repeat run will produce another number and nobody will be able to reconstruct the cause.
Create a sample record. Include model and serial number, processor, memory capacity and module count, storage devices, graphics adapter, power supply or external adapter, display size and mode, BIOS version, operating system version, drivers, and power plan. For an all-in-one, record actual brightness in cd/m² if you have an instrument, or record the percentage and how you set it. Do the same for a separate monitor.
It is better to normalize brightness by measured luminance because 70% in two display menus does not mean the same amount of light. If you have no light meter or colorimeter, choose a practical target in the menu, disable automatic brightness, and state the limitation. Do not leave one screen at the factory 100% setting and the other on an economy profile.
Room temperature affects fans and processor boost behavior. A normal office without direct sun or a strong air-conditioning draft is sufficient, but record the temperature at the start and end of the series. The network must also be the same: a wired connection at the same speed or one Wi-Fi access point with comparable signal. Leave Wake-on-LAN, Bluetooth, and other interfaces in the state the organization intends to use.
After startup, wait for booting, updates, indexing, and initial setup to finish. Restart the device and allow the same stabilization period, such as 15 minutes. This is not a universal magic pause; it is a protocol agreement. Watch the task manager. If the processor or drive is still active because of maintenance, record the cause and do not call that interval idle.
Capture system settings with commands so the report can be revisited:
powercfg /getactivescheme
powercfg /a
powercfg /requests
The first command records the active power plan, the second lists available sleep states, and the third finds processes and drivers blocking sleep. Save the ordinary text output beside the sample record. These commands do not measure watts, but they explain why two apparently identical computers behave differently.
Off, sleep, and idle are separate modes
A shut-down computer left plugged in, a sleeping computer, and a running system without user activity consume different amounts and spend different lengths of time in those states. "Standby" is too vague for a protocol. Use observable states and describe how the computer entered each one.
Begin with an operating system shutdown. Keep the plug connected, wait for the reading to stabilize, and accumulate energy for at least 15 minutes. This result includes standby circuits, possible Wake-on-LAN activity, and adapter losses. A mechanical switch on a power strip creates a different state and is inappropriate if employees do not normally use it.
Next, put the computer to sleep with the operating system's standard command. Confirm that the screen turns off, the fans stop or enter their intended mode, and the computer actually wakes on the event approved by the organization. Network wake can increase consumption, so do not turn it off merely to improve the table if operations staff use overnight management.
Measure short idle with the screen on after boot and background tasks have settled. You can define long idle as a running system whose display has turned off but that has not yet entered sleep. ENERGY STAR separates Short Idle and Long Idle precisely because display blanking and active power management change the result noticeably. You can choose other intervals for your calculation, but the definitions must remain unambiguous.
In each stable mode, record average, minimum, and maximum active power, duration, and accumulated energy. Calculate the average from energy:
Pavg, W = E, Wh / t, h
If the instrument accumulates 8.4 Wh over 20 minutes, average power is 8.4 / 0.333 = 25.2 W. This calculation is more reliable than averaging three arbitrary readings. For low sleep consumption, extend the interval to an hour if the meter's resolution does not yield enough significant digits.
Do not charge phones over USB during this measurement or leave an installer running in the background. If that load belongs in the real scenario, assign it a separate share of time rather than letting it appear randomly on one sample. A good protocol does not make the workstation sterile; it makes every influence visible.
The office workload must resemble the workday
"Open a browser" is too vague for a comparison. A static text tab, a video conference, and a demanding web application place different loads on the processor, graphics, and network. Build a short scenario from operations that users in the purchased fleet actually perform, then run it in the same order on every candidate.
A 30-minute cycle works for a typical administrative workstation:
- Edit a local text document for five minutes and save it once per minute.
- Work with the same large spreadsheet for eight minutes: recalculate formulas, sort data, and export to PDF.
- View a saved set of web pages for seven minutes and scroll them on a timer.
- Play a local video for five minutes at the same volume and brightness.
- Hold a five-minute test video call in a local environment or one approved by the organization.
The exact files must be identical and stored with the protocol. Save web pages locally or serve them from an internal test host, because advertising, network delays, and changed content will ruin repeatability. For video calls, record camera resolution, participant count, background blur, and transmission method, since software effects can load the processor more heavily than video encoding itself.
The instrument must accumulate energy throughout the cycle. Calculate the office workload result as Wh divided by 0.5 hours. You may record system telemetry at the same time, but do not substitute it for the wall measurement. Software sensors usually see individual components, not power supply losses, the monitor, and every peripheral.
Save one CSV row for each run. This format is easy to inspect without a special system:
sample_id,config_id,run,start_utc,duration_min,energy_Wh,avg_W,min_W,max_W,room_C,notes
AIO-01,M200-test,1,09:00,30,14.8,29.6,18.1,67.4,23.1,updates_off
The numbers in the example demonstrate the record shape, not a target for a particular model. Complete at least three full runs after one practice run. The practice pass exposes pop-ups, file caching, and operator mistakes, so do not include it in the result. If the three results differ by more than the expected error, find the cause instead of averaging away the problem.
Different user groups need different weights. Accounting may spend longer in spreadsheets, a contact center may keep voice communications active for nearly the whole day, and a design department needs another computer class and scenario. Do not use one "office" cycle to justify all 500 computers when their work differs.
Peak power tests electrical and thermal capacity
Peak power is needed to check electrical infrastructure, size a UPS, and find throttling, but you cannot multiply it by the entire working year. A computer rarely holds its processor, graphics, storage, and display at maximum load simultaneously. Calculating annual cost from the peak inflates the budget and can change the candidate ranking without justification.
Use a load suited to the workstation class. For a normal office, a repeatable combination of intensive spreadsheet recalculation, a video conference, and copying a local file set is enough. An engineering workstation needs rendering, compilation, or analysis tasks approved by the organization. A synthetic stress test is useful for checking the limit, but call its result "stress," not "office peak."
Bring the system to the same starting temperature before each run. Run the load for at least 15 minutes and watch for power dropping after a few minutes because of a thermal or electrical limit. An instantaneous spike at application launch and settled high load answer different questions. A logging analyzer shows both; a simple wattmeter with a Max function may catch a short spike but cannot explain its duration.
Record three values: the highest observed reading, average power over the settled interval, and energy for the complete peak scenario. Volt-amperes and power factor also matter for a UPS if the instrument measures them correctly. Do not use the sum of power supply nameplate ratings as the building's expected load. The rating states how much a supply can deliver to components, not what the workstation constantly draws from the grid.
Check temperature and performance alongside power. Lower watts do not mean efficiency if the computer reduces its clock and takes longer to finish. Energy per task is useful for a finite operation:
Energy_per_task, Wh = average_power_W * task_time_h
A 70 W candidate that completes an export in 6 minutes uses 7 Wh. A 55 W candidate taking 10 minutes uses 9.17 Wh. This example shows why power and energy are not interchangeable and why heavy work needs a completed result, not merely a meter reading.
Annual use comes from time in each mode
Annual consumption comes from the average power in each mode and the actual number of hours spent there. One averaged watt figure does not know whether computers shut down at night, sleep over lunch, or sit unattended while staff attend meetings. Agree on a profile first, then insert the measurements.
For one device, use this formula:
Annual_kWh = workdays * (Poffice * Hoff + Pidle * Hidle + Psleep * Hsleep) / 1000
           + nonwork_days * Psleep_nonwork * Hnonwork / 1000
If computers are shut down through software overnight, substitute the measured off-mode power for sleep. If the power management policy is not actually enforced, do not draw an ideal sleep transition after ten minutes. Build the baseline from current management logs or observation and show an efficient scenario separately as a policy change.
Consider one workstation with 220 workdays, 5.5 hours of office load at 32 W, 1.5 hours idle at 24 W, and 17 hours asleep at 1.2 W. On 145 nonwork days, the device remains asleep for all 24 hours. The calculation is:
Workdays: 220 * (32*5.5 + 24*1.5 + 1.2*17) / 1000 = 51.13 kWh
Nonwork:  145 * (1.2*24) / 1000 = 4.18 kWh
Annual:   55.31 kWh per workstation
This is a teaching calculation, not a promise for an all-in-one or desktop PC. Insert your measurements and the organization's calendar. If the desktop set's monitor was connected through the same meter, its use is already included, so do not add it again.
Calculate money after energy:
Annual_cost = Annual_kWh * tariff_per_kWh
Fleet_cost  = Annual_cost * device_count
Use the organization's actual tariff with applicable zones, taxes, and contract terms. If the tariff changes by time of day, divide mode hours among the tariff periods. Do not mix today's average rate with a five-year forecast without explanation. Show the base rate, a growth scenario, and totals in consistent prices.
Electricity consumed by a computer becomes heat in the room. An engineer designing cooling needs load over time, not only annual kWh. Do not promise a precise cooling saving from a coefficient found online because it depends on climate, building use, and the ventilation system. Give the designer measured average and peak watts by zone.
Five hundred devices need a range
Scaling starts by multiplying one workstation's result by the number of identical seats, but the analysis cannot stop there. The fleet is spread across people, buildings, and schedules. One exact total creates false confidence while operating hours and sleep settings are still under discussion.
Build at least three scenarios: observed, efficient, and adverse. Use employees' current habits in the observed case. Apply approved display and sleep timeouts without changing performance in the efficient case. In the adverse case, increase office hours, the share of idle time with the display on, and the number of devices left awake overnight. Show kWh per seat, kWh for 500 seats, and money for each case.
It is useful to calculate the payback threshold for a difference in purchase price:
Annual_saving_500 = (kWh_A - kWh_B) * 500 * tariff
Payback_years = price_difference_500 / Annual_saving_500
If energy savings are negative or close to uncertainty, an electricity payback period has no meaning. Do not force the formula to justify a preferred option. An all-in-one may offer other benefits for space and cable management, while individual desktop components may be easier to replace. Assess those as separate criteria rather than hiding them in the tariff.
Run a sensitivity analysis. Change the tariff, workdays, active hours, and sleep probability one parameter at a time. If a small adjustment changes the winner, power consumption does not offer a stable basis for selection. If the difference persists in every plausible case and exceeds measurement uncertainty, you can include it in total cost of ownership.
For a mixed purchase, calculate groups separately. You cannot fairly reduce 320 standard office seats, 120 two-display seats, and 60 high-performance workstations to one average computer. Each group needs its own equipment boundary, scenario, and calendar, then the results can be added at fleet level.
Finally, separate measured savings from management savings. The difference between two models belongs to the hardware. A move from no sleep policy to automatic sleep belongs to operations policy and may have a larger effect than changing models. The report needs two lines, or the supplier will receive credit for a setting the IT team could apply to both candidates.
Repeats show whether the difference exists
One run is an observation, not a reliable model characteristic. Repeat the same scenario at least three times on every sample and compare both the mean and spread. If the second run uses noticeably less energy because the cache is warm, that is a property of the scenario. Either clear the cache before every run or keep it honestly as part of a normal workday and apply the same rule to all candidates.
For a small dataset, show the minimum, maximum, and mean. The median is useful when a background task spoils one run, but do not silently delete an inconvenient result. Record the event, explain the exclusion rule, and repeat the measurement. It is too late to invent a new criterion after seeing the numbers.
Uncertainty includes at least meter error, rounding of accumulated energy, run-to-run spread, and differences among samples. A procurement panel does not need a complex statistical model if the team cannot defend it. State the repeat range and expand it by the meter's declared error. This conservative interval is clearer than a falsely precise result with several decimal places.
Suppose candidate A uses 14.6 to 15.0 Wh in the office cycle and candidate B uses 14.9 to 15.3 Wh. The ranges overlap, so it is too early to claim that A is reliably more efficient. Tenths can look like a large sum after multiplication by 500, but multiplication does not repair a weak source measurement.
Test units from different boxes too. Three repeats on one computer measure bench repeatability; measurements on several computers measure batch variation. These are different questions. The second matters for acceptance because the supplier is delivering a fleet, not one carefully prepared demonstration unit.
Define a practical threshold in advance. If a difference under, for example, 1 W in office mode barely affects ownership cost, the organization may call it immaterial even if it is statistically distinct. The threshold must come from money, risk, and instrument capability, not appear after the panel sees the winner's name.
Turn the protocol into an acceptance requirement
A pre-purchase test is useful only when its result can be checked on the delivered batch. In the technical specification, state the configuration, setting versions, measurement boundary, scenarios, duration, acceptable instrument, room conditions, sample count, and result processing rule. "Power consumption no higher than N W" without a mode and method almost guarantees a dispute.
Do not set one limit for everything. It is more sensible to specify separate requirements for off or sleep, settled idle, average office-cycle power, and the peak used for infrastructure. For the office cycle, also limit Wh for the complete scenario because it is more stable than one instantaneous reading.
The acceptance rule must account for variation. For example, randomly select five devices from each configuration, run one shorter verification cycle after checking settings, and if one result exceeds tolerance, repeat the complete three-run test on that sample and two additional units. The buyer chooses exact numbers according to risk and batch size; writing the rule before boxes are opened matters more.
Add configuration control through a component and firmware list. A delivery with a different power supply, display panel, or storage device may fit the functional description yet change consumption. The supplier should demonstrate equivalence with the same method, not with a letter saying a component is "no worse."
The final panel table should fit on one page. Put candidates in rows and use these columns: equipment set, Off W, Sleep W, Short Idle W, Long Idle W, Office Wh/30 min, Office avg W, Peak sustained W, Peak max W, annual kWh for three scenarios, cost for 500 seats, and uncertainty. Run protocols, CSV files, and system details belong in appendices.
When comparing GSE L200 and M200 series, this protocol lets the buyer agree on a specific configuration with the manufacturer and verify it after delivery instead of relying on a general catalog. The purpose is not to obtain the lowest wattage at any cost. It is to buy 500 capable workstations with expenses that finance and technical teams can reproduce with a calculator and wattmeter.
Frequently asked questions
Can I measure PC power consumption with a regular smart plug?
You can use one for an initial estimate if it displays active power and accumulated Wh. For a procurement protocol, check its low-power error and calibration, because it may misread sleep consumption of only a few watts.
Should I include the desktop computer's monitor?
Yes, when comparing a desktop workstation with an all-in-one. Connect the system unit and supplied monitor after one meter or add synchronized readings, or the desktop result will be understated.
How long should I measure sleep mode?
For a stable mode, integrating for 15 minutes is usually enough, but an hour is better at very low power. The interval must accumulate enough energy that the meter's resolution does not determine the whole result.
Why can't I use the power supply rating?
The rating states the supply's allowed output, not constant consumption at the wall. Actual use depends on component load, supply efficiency, the display, settings, and time spent in each mode.
What screen brightness should I use for comparison?
Set the same measured luminance at a level suitable for the workplace. If you cannot measure it, use a fixed percentage, disable automatic brightness, and record that limitation in the protocol.
Is one sample of each model enough?
One sample is enough to develop the method, but not to assess batch variation. Test several final configurations before purchase and repeat a shorter check on randomly selected delivered units.
How do I calculate electricity cost for 500 PCs?
First add Wh across modes according to hours and days, then convert the result to annual kWh per workstation. Multiply by 500 and the organization's actual tariff, while calculating different user groups separately.
Should Wake-on-LAN be enabled during the test?
Leave it enabled if the IT team will use remote wake. Turning it off for a lower figure creates a result for a configuration that will not be used in production.
Does peak power show annual consumption?
No. Peak power is mainly for the UPS, wiring, and cooling checks. Calculate annual energy from average power and the duration of real modes rather than applying a short maximum to the entire day.
What if the difference between candidates is very small?
Compare the difference with meter error and the spread across repeated runs. If they are similar in size, treat the options as equal on energy and decide using price, performance, service, and other separate criteria.