Zabbix monitoring without subscriptions: templates, triggers, maps
Zabbix monitoring without subscriptions: how to configure templates, triggers and maps to see service and business risks — not just uptime.
What's wrong with "alive/dead" monitoring
"Ping responds" only shows one thing: the device answers on the network. But the service itself can already be unavailable. The web portal may not open because of an application error, the database might be stuck, the disk full, a certificate expired, a message queue stopped — and users still see "it's not working."
This kind of monitoring is dangerous because it reassures. The on-call shift sees silence, green statuses, while the business loses time and money. It's worse when notifications arrive only at full failure. Then the team learns about the problem too late: downtime has already started, deadlines slip, customers complain.
Monitoring must answer not "is the server alive?" but "how close are we to failure and what are the consequences?" In organizations with critical services (government services, clinics, banks, educational portals) it's more important to see the risk to booking an appointment, processing a payment, or issuing a certificate than just host availability.
A good check is always tied to a user action. If the site opens but login fails, that's already an incident for the business. If backups stopped running, it's not an immediate outage, but it's a high risk for tomorrow.
Monitoring should address business questions:
- Does the key user scenario work (login, search, payment, booking)?
- Where exactly did the chain break (DNS, network, DB, application, external provider)?
- How much time do we have until failure (disk space, error growth, load)?
- Which service is at risk and what is the incident priority?
- Who should respond and what to check in the first minute?
All this can be built in Zabbix without subscriptions: templates for typical nodes, OS and application metrics, triggers that catch degradation not just "fell over", plus maps and business services so you can see where the risk is and who is affected.
Where to start: services, dependencies and criticality
If you start from hosts, you'll quickly get hundreds of signals and little understanding of what actually hurts people. It's more practical to start from services: what the user does and where the business loses money or trust. Then monitoring works as early warning, not as a "siren."
Create a short inventory not by org structure but by user scenarios. Often 30–60 minutes talking with the process owner and IT is enough: what 3–5 actions does a person need to perform daily, when are they critical, what counts as a failure ("slow", "error", "data not updated"), is there a workaround and how long is it acceptable, who decides "this is an incident" and who says "wait a bit."
Next, break the service down into dependencies. This helps avoid confusing cause and effect: "site unavailable" may be DNS, link, load balancer, database, or an external provider.
It's convenient to draw the chain top-down: service -> application -> DB -> OS/server -> network/power, plus external points (SMS gateway, government services, payment provider). Later this becomes maps and business services.
Then set the business "it hurts" threshold. Not "CPU 90%", but what the user will notice: response time, error rate, number of failed transactions, queue lag, packet loss. For example: "if login takes more than 8 seconds for over 5 minutes, the operator shift starts to break down."
Finally, agree on criticality. A simple P1–P3 scale with escalation rules usually suffices: P1 — money/security/process stop; P2 — degradation without stoppage; P3 — inconvenience. These agreements form the basis for priorities and notification routing.
How Zabbix templates are structured and how to plan them
A Zabbix template is a set of monitoring rules you can attach to dozens or hundreds of hosts. It defines the standard: which metrics to collect, how to interpret failures, what to show on graphs, and how to separate important from secondary. Without templates, configuration quickly becomes manual work per server and endless chaos.
What a good template contains
A template usually rests on a few elements:
- Items collect values (CPU load, API response latency, disk free space).
- Triggers turn numbers into states (ok, warning, problem).
- Graphs show dynamics.
- Discovery (LLD) automatically finds repeating objects: filesystems, interfaces, databases, services.
It's better to plan templates by role rather than hardware. Separate templates for web server, database, and load balancer are easier to maintain than one huge "catch-all". It's simpler to change thresholds without breaking checks where they aren't needed.
Macros, environments and naming order
The same logic should work in prod, test and branches but with different thresholds. Use macros for that. For example, one trigger "low disk space" can read {$DISK.MIN.FREE} and get different values for prod and test.
To speed up incident analysis agree on simple rules: unified metric naming (what, where, units), tags on triggers (service=payments, layer=db, env=prod), clear event names ("Rise in 5xx errors — risk of site unavailability"), and separation by importance (not all warnings should wake someone at night).
If the company has many standard sites (offices, hospitals, schools, DCs), these standards are especially useful: one monitoring model, differences set by macros and tags rather than manual edits.
Which metrics to collect to see service quality
If you only collect "ping" and CPU load, you will see failures but not how the service suffers. Metrics should answer a simple question: can the user complete their task now or not?
Start with a basic OS set. It's not for pretty graphs but to quickly tell whether it's the server or the application: CPU (including iowait), RAM (including swap growth), disk (free space and I/O latency/queues), network (losses, interface errors, channel utilization), time sync (clock drift often breaks authentication and logs).
Then add role-based metrics. For a hypervisor, watch noisy VMs and node resource shortage. For a file server — disk latency and SMB/NFS errors. For terminal servers — active sessions and login time. For AD — replication, queues and LDAP/Kerberos response time.
Service quality often breaks at application and DB level. Collect not just "process running" but what the client feels: response time of a key query, error share (5xx, timeouts), queue length, connection count and locks in DB. Even if base resources are normal (for example, on high-end racks with GSE S200 Series servers), rising DB locks already signal a risk to payments, patient bookings or certificate issuance.
To avoid drowning in similar elements, use LLD: auto-discovery of disks, interfaces, filesystems, and services. The template will pick up a new disk or interface and add checks.
Keep 1–2 user-facing checks: open the login page, perform a simple query, get a successful API response. These are among the best indicators of real quality.
Step-by-step: build the first “correct” monitoring in Zabbix
To make Zabbix show more than "alive/dead", start with one service and build a clear risk picture. This is almost always faster than trying to cover the entire infrastructure at once.
Choose a service that matters to people, not just hardware: "corporate mail", "ticket portal", "electronic registration". Draw the dependency chain: DNS -> load balancer -> web/app -> database -> storage -> network. In reality some links are physical, some virtual, and the relationships determine what counts as an incident.
Create the first template and apply it to a group rather than a single host. This disciplines naming, metrics, tags and thresholds to be consistent.
A typical workflow:
- Describe the service and its dependencies, mark what is critical and what tolerates degradation.
- Make a basic template: availability, latencies, key resource and application metrics, plus tags for filtering.
- Add LLD where there are many objects (disks, interfaces, filesystems) and put thresholds into macros.
- Check data hygiene: units (ms, %, B/s), consistent intervals, clear names.
- Build a small dashboard and enable notifications only for things that require action.
Before alerting the whole team, check message quality. On a real incident a notification should answer three questions: what broke, how it affects the service, what to check first. For example, one interface down is not always an incident, while rising DB latency during peak hours is a service risk even if the host is "alive."
Triggers: turning metrics into clear risks
Metrics rarely help alone during an incident. "CPU 92%" or "ping rose" doesn't explain if there's a service risk or what to do now. Triggers translate numbers into events — into manageable risks.
The main pain is noise. If an alert arrives every 5 minutes and often "self-resolves", the team stops reacting.
To avoid flapping set thresholds with margin and use hysteresis: different conditions for "bad" and "ok." For example: "disk > 90% for 10 minutes" and "recovered when < 85%". You catch trends, not spikes.
Build events in layers: symptoms separate from causes. That reduces clutter and finds the source faster.
Some rules that usually work:
- Create triggers only for actions (what you will do if it fires).
- Add time confirmation (5–15 minutes) for volatile metrics.
- Separate degradation and failure (slow vs unavailable).
- Keep one main alert per problem; others serve diagnostics.
- Write clear event names: what broke and what risk it poses to the service.
Trigger dependencies are a powerful tool. If the network or top switch fails, you don't need hundreds of "host unavailable" alerts. Configure suppression so a "network node problem" suppresses downstream "hosts unreachable." This is crucial across racks or sites.
Severity and tags determine routing: critical events go to the on-call, degradations to a backlog, and warnings remain for planned work.
Maps, services and dashboards: showing the business picture
If monitoring only shows "host alive" it doesn't answer the main question: what will happen to the user-facing service. In Zabbix this is solved with maps, business services and concise dashboards. Then the system speaks the language of risk: "service degrading" rather than "server has issues."
Maps: connections and bottlenecks
An infrastructure map is not for aesthetics. It helps quickly see where the chain breaks: a switch, link, cluster, rack, or service contour.
A good map shows flow: user -> load balancer -> web -> DB -> storage. Mark single points of failure (for example, one switch for multiple segments). During an incident you can see why "everything fell at once."
Business service: service status from component states
A business service in Zabbix is built as a tree: at the top the service (e.g., "Electronic Reception"), below components (DNS, link, web, DB, queue, certificates). Configure not only down states but also degradation: a service can be available but slow or partially broken.
Weighting helps: not all components are equal. Losing one of two web nodes is degradation, not a stop. A TLS certificate expiring in 3 days is a risk that isn't red today but should be visible.
Create dashboards by role, otherwise people stop looking:
- On-call: top problematic services, current alerts, "what to do now."
- Admin: utilization, queues, latencies, capacity, trends.
- Manager: status of key services and recovery time without technical details.
- Service manager: availability by service and causes of downtime.
Availability reports are useful but easy to misinterpret. Don't mix "host available" with "service works for users", planned windows with real incidents, failures and degradations, availability and performance.
Common mistakes when configuring Zabbix
Most problems aren't lack of features but overload: hundreds of checks, dozens of alerts per hour, and nobody understands what actually failed and how dangerous it is.
Noise instead of signal
One extreme is enabling too many checks and polling every 10–30 seconds "just in case." This overloads the agent, network and Zabbix itself without benefit if the metric doesn't affect decisions.
The opposite extreme is polling too rarely. If a web service is checked every 10 minutes, users will notice the problem before you.
Another noise source is the same thresholds for different contexts. A level of CPU, disk or latency may be normal for a DB server but alarming for an office file server. Branch sites: ping 50 ms can be normal, while in a data center it signals degradation.
Alert exists, no action
A trigger without context looks like "Disk space low" and stops there. The on-call wastes time finding which partition, what's on it, where logs live, whom to call.
Good practice: alerts with guidance — what it means for the service, likely causes, first steps to check. For example: which service depends on the node, where logs are, contact for the on-call group.
People often forget dependencies, suppression and maintenance windows. Then a link failure produces dozens of "everything died" alerts while the cause is one. During planned works the team burns out on false alarms.
Sometimes teams collect metrics "because we can" but miss key service quality metrics (response times, errors, queue fill, critical port availability). Rule of thumb: every metric either warns of risk or helps quickly find the cause.
Quick checklist: is monitoring ready for real incidents?
Monitoring is useful only if it helps decide in minutes: what broke, how critical it is, who responds and what happens if nothing is done.
First ensure there is a business picture, not a set of disconnected hosts. If one server fails but the service keeps working via redundancy, the on-call doesn't need a "fire alarm."
Minimum essentials to avoid repeated incidents
- The service has a dependency diagram and an owner (tech lead, admin, contractor). Without an owner an alert becomes "nobody's."
- Triggers are separated by meaning: causes (disk full, queue growing, I/O stuck) and symptoms (site unavailable, timeouts).
- Degradation thresholds are set in advance: not only "down" but "worse" (errors, latency, queue, disk space, response time). Preferably two levels: warning and critical.
- Notifications are routed by tags: service, environment (prod/test), criticality, type (security, storage, network).
- There are two types of dashboards: for on-call (what to do now) and for managers (which services are at risk and why).
Quick live checks
Before a real incident run a small test:
- Schedule maintenance and confirm alerts are suppressed and return after the window.
- Test flapping protection: short spikes should not wake someone at night.
- Simulate degradation (e.g., fill a test disk or increase latency) and verify that a "service risk" rises, not just the host turning red.
Example: how Zabbix shows service risk, not host status
Imagine a government agency or a bank: there's a citizen-facing application and a staff console. Both run on the same infrastructure but are different for the business. If "all hosts ping", it doesn't mean people can submit forms.
Degradation often starts quietly. The site opens but forms submit slower. Then some requests begin returning HTTP 500. The DB queue grows and users call support. Monitoring is useful as risk management, not just a lamp.
To show risk before failure you often only need a combination of metrics and triggers that catch deterioration in the right order: API response time (p95) rises for 5–10 minutes, then 5xx exceeds threshold, simultaneously DB queue or replication lag grows, and at the bottom a technical cause appears (I/O wait, CPU steal, disk filling).
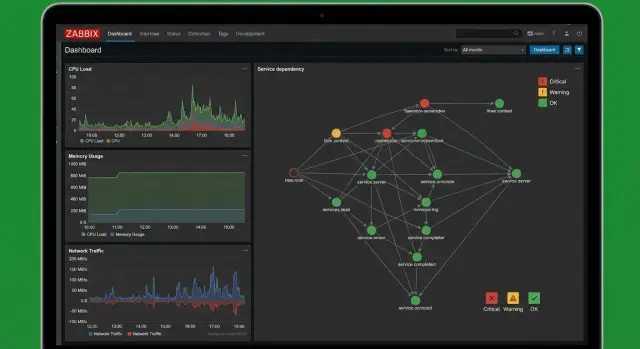
Presentation matters. On the map you see not "server 1 red" but "Applications intake: high risk" and lower the dependent nodes: API, DB, queue, load balancer. Drilling into events shows what fired first, what is secondary, and the likely cause. This saves time: you don't guess which of ten hosts is guilty.
In conversations with the business keep it simple: what functionality is impacted (e.g., form submission), how many users are affected, what will happen next (queue growth and repeated errors), and an estimated recovery trend. Even a rough forecast of queue trend and processing speed is more useful than "we're checking servers."
Next steps: scaling and maintaining monitoring
Once the basic scheme shows service risks, the next question is simple: how to keep things clear in six months, not turn into a set of random checks.
Start with a pilot on one service that has an owner and a clear cost of downtime: "electronic registration" in a clinic or "payment gateway" in a bank. Harden templates, triggers, dependencies and the map until the on-call can tell in 30 seconds what broke, who is affected and what to check first.
Then replicate the approach, not the configs as-is. For templates to live long you need standards and change control: versioning templates with short notes "what and why changed", a "gold" set separate from experimental ones, unified naming rules, and a monthly review (what makes noise, what's unused, where owners are missing).
Think about scale. If there are many branches, lots of network gear, diverse OS fleet and 24/7 response is required, engaging an integrator makes sense.
Link monitoring with capacity planning. Don't stop at alerts like "disk running out". Watch trends in CPU, memory, IOPS, queues, DB growth and peak hours. Then the decision to add resources happens ahead of time, not at night during an incident.
If infrastructure is also your responsibility it's easier when monitoring, server platform and support are aligned. In such cases a vendor or integrator like GSE.kz (gse.kz) can help with standard hardware platforms and regulated support, while leaving your service monitoring logic intact.
FAQ
Why does “ping responds” not mean the service works?
“Ping responds” only shows that the host answers on the network. The service itself can be unavailable due to application errors, a stuck database, a full disk, an expired certificate, or a stopped queue. It's more reliable to check what the user does: login, request, payment, registration, or an API response.
Where is the best place to start configuring monitoring in Zabbix to avoid chaos?
Start with the single most important user scenario and agree what counts as a business failure: slow, errors, or data not updated. Then map the service dependencies (DNS, network, load balancer, application, database, storage, external providers) and only after that add metrics and alerts. This order shows where the risk is, not just “something is red.”
Why do you need Zabbix templates and how should they be divided?
A template defines a monitoring standard and lets you quickly apply the same elements to dozens of hosts. A good practice is to create templates by role (web, DB, load balancer), not one monolithic template, so you can change thresholds without breaking unrelated checks. This yields consistent metric names, clear graphs, and predictable alerts.
How to set different thresholds for prod, test and branches without copying templates?
Extract thresholds into macros and set values at the host or group level: prod has one set, test and branches have others. The same trigger then works everywhere but with the right numbers, drastically reducing manual edits and errors when rolling out monitoring.
What is LLD (low-level discovery) and when is it really needed?
LLD automatically discovers repeating objects that change frequently: filesystems, disks, network interfaces, services. It's useful when new disks or interfaces appear and you don't want to add items and triggers manually each time. Auto-discovery saves time and reduces gaps in coverage.
Which metrics should be collected to see service quality and not just resources?
Collect a basic OS set to tell server issues from application issues: CPU including iowait, memory including swap growth, disk free space and I/O latency, network losses and interface errors, and time synchronization (clock drift often breaks auth and logs). Then add role-specific and service-quality metrics: key request response times, error rates, queue lengths, DB locks and connections. And keep 1–2 user-facing checks (open login page, run a simple query, get a successful API response) — they are among the best indicators of real quality.
How to configure triggers to avoid noise and flapping?
Create triggers that map to an action: if a trigger fires, it should be clear what to check. Use time confirmation and hysteresis to catch trends, not spikes, and separate degradation from complete failure. A clear event name should explain the risk to the service, not just a metric value.
How to avoid hundreds of alerts when the network or a common node goes down?
Set trigger dependencies so one root cause doesn't generate hundreds of symptoms. For example, if a link or switch fails, downstream “host unavailable” alerts should be suppressed, leaving a single top-level alert about the network issue. This speeds diagnosis and reduces on-call burnout.
How to show the business picture in Zabbix with services, maps and dashboards?
Build a business service tree: at the top the user scenario, below the components and their states, including degradation not just down. Make separate dashboards by role: on-call—what's burning and what to do now; admins—utilization, queues, delays and capacity; managers—service status without technical detail. Then monitoring helps decision-making rather than only showing infrastructure.
How to scale monitoring so it doesn't turn into a mess after six months?
Start with a polished pilot on one service: templates, tags, thresholds, dependencies, clear notifications and owners. Then scale the approach, not the raw configs, and do regular reviews: what makes noise, what is unused, where there is no owner. For large infrastructures with many sites and 24/7 requirements, consider engaging an integrator; for example, GSE.kz can cover hardware platforms and support while you keep your monitoring logic.