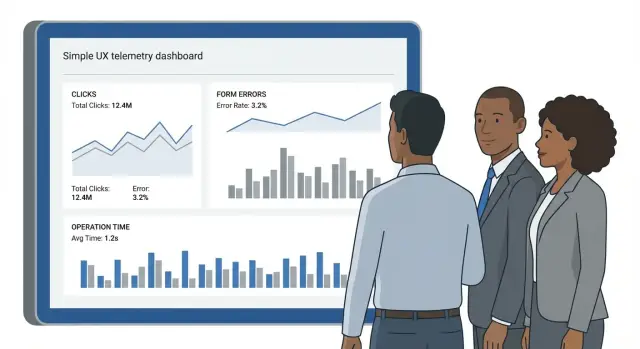
UX telemetry in corporate systems: clicks and errors without PII
UX telemetry in a corporate system reveals clicks, form errors and operation times without collecting unnecessary PII, turning observations into actionable UI improvements.
Why UX telemetry is needed and what it solves
In corporate systems many UX questions remain unanswered even when there is support and training. A user says “it doesn’t work”, “it’s slow”, or “hard to find”, but it’s unclear where they got stuck, what they clicked before an error, and how long a specific step took.
UX telemetry closes that gap. It shows interface behavior in numbers: what people try to do, where they make mistakes, which screens make them go back, and which operations take longer than expected.
User complaints are useful, but rarely precise. Not everyone reports issues, details get lost, and descriptions depend on emotion and context. The same bug can be described as “a button disappeared”, “the system froze”, or “nothing saves”. Telemetry lets you reconstruct the situation from facts: which screen, which form, which step, and how it ended.
In practice, problem areas are most often found with metrics like: where and how often form errors occur (by field and step), how long an operation takes from start to success and how many attempts were needed, where loops and returns happen (reopening screens, cancels, back navigation), which features are used daily and which are barely touched. It’s also useful to track interface and technical failures (timeouts, service unavailability) tied to specific scenarios.
Important point: “without unnecessary personal data” means you collect events, not people. Don’t send full names, phone numbers, emails, IIN, comment text, field contents or files to analytics. Instead capture anonymized context: session identifier, role or user type (e.g. operator, accountant), screen and action, error code, and step duration.
This gives material to improve the interface and service quality without turning analytics into a PII collection and without complicating security and compliance approvals.
What to collect exactly: clicks, errors, time and context
For telemetry to be useful, events should answer a simple question: what prevents people from completing a task. Collect not everything, but only what helps find bottlenecks and verify the effect of improvements.
Clicks and paths: where users get lost
Clicks are not valuable by themselves but as a sequence of actions. It’s more useful to record transitions between key scenario steps: screen opened, action chosen, submit attempt, cancel, back. If a screen has many elements, mark the 5–10 most important ones. Then you can see where people look in the “wrong” place and where they truly get stuck.
Often events that state “what they wanted to do” are enough, rather than cursor coordinates. For example: invoice_create_clicked, filter_applied, export_started.
Form errors: what breaks the filling flow
For forms, collect the fact of an error and its type, not what was entered. An event usually needs the field name, error kind (empty, wrong format, too long), the step when it appeared, and how many times it repeated before a successful submit.
Example: an employee fills a service-desk request. Telemetry shows the “IIN/BIN” field yields format errors in 40% of attempts and people correct input 3–4 times. That’s a signal: the hint is unclear, there’s no input mask, or the validation rule is too strict.
Operation time: waiting, completion, timeout
Measure task durations where waiting occurs: search, list loading, saving, form submit. Separate operation start (click or auto-start), waiting for response, successful completion or error, timeout and retry, and user cancellation.
This makes it easier to tell “clumsy UI” from “slow server” and spot places where people leave before waiting.
Also capture technical signals: frontend errors, network failures, response codes and exception types. That helps link complaints to specific failures.
Additionally add non-identifying segments: role (operator, manager), large-group division, device type (PC, tablet), browser, and branch-level region. That’s enough to compare experiences across groups without collecting extra personal data.
How not to collect too much: privacy and security principles
Telemetry is useful only while it answers interface questions, not questions about particular people. In corporate systems this is critical: one extra parameter in an event can turn “click analytics” into a PII collection.
The main principle is minimization. Before adding any field ask: “What UI improvement decision can we make if this field is in the data?” If there’s no answer, don’t add the field. For clicks and operation times it’s usually enough to know which screen was open, what action occurred, how the operation ended (success or error), and how long it took.
Personal identifiers are better replaced with pseudonyms and aggregates. Instead of full name, login, personnel number or email use a random technical identifier with a short lifetime, or collect metrics at the group level (e.g. “role: operator/manager”, “division: yes/no”) without names. That helps find problematic scenarios but prevents “tracking” users.
A separate risk zone is typed data. Don’t record field contents, comments, messages or attachments. Validation errors can be recorded safely: error code, field name and check type (empty, wrong format, too long), but not what the user entered.
Common practical rules that close most risks: ban any free-text fields (allow only code lists and identifiers), mask technical parameters that may contain PII (for example, URLs with query strings, headers, exceptions), separate access (engineers see raw events for a limited time, product and UX work with aggregates), and set retention periods with automatic deletion.
If the system is used in government or healthcare, agree rules with InfoSec and legal teams beforehand and record them in settings. In projects that roll out workstations, servers and monitoring contours in parallel, it’s convenient to make two levels from the start: “raw events” with strict limits and “reports” for teams improving UX.
Designing events: a simple data model for UX
Good telemetry starts not with a tool but with a clear event model. If names, parameters and units are defined in advance, the team finds causes faster and disputes less about what numbers mean.
Minimal event schema
Think of an event as a record of “what happened, where, when and what the UI state was.” Fields should be short, predictable and free of personal data.
Usually the following set is enough:
event_name(e.g.form_submit,field_error,operation_start,operation_end)screen_id(screen identifier:request_create,profile_edit)action_id(what was done:click_save,open_modal,select_tab)session_id(random session identifier with limited lifetime)tsandtimezone(event time)
Keep parameters in consistent units: durations in duration_ms, counts in count, sizes in bytes. For clicks, prefer semantic targets over pixel coordinates: target (e.g. btn_save) and position (e.g. header, footer). This helps data survive a redesign.
Operation timing: start, end and steps
To see where people lose time, measure not only total duration but stages. A working pattern: operation_start with operation_id, then operation_step (e.g. validation_done, server_response_received), and operation_end with status (success or fail) and duration_ms.
This exposes the difference between slow loading, long input time and server-side delay.
Form errors: consistent categories
Code error classes rather than texts. Texts change and often contain extra data.
Suitable classes:
required— required field not filledformat— wrong format (email, IIN, phone)range— value out of allowed boundsserver— server response error or unavailabilityconflict— data conflict (for example, already exists)
For each error include field_id, error_type and attempt (submit attempt number). Do not send the entered value.
Versioning: when the UI changes
UIs change constantly, and without versions metrics quickly “break”. Add at least two fields: schema_version (event format version) and ui_version (frontend or release version). If part of the audience is behind a feature flag, record experiment or feature_flag.
Simple rule: if you change the meaning of a parameter or its units — increase schema_version. If you rename an interface element — keep the old target as an alias during transition to avoid losing trends.
Step by step: how to add telemetry to an existing system
Start small. Telemetry pays off when you measure things that affect people’s daily work.
A practical rollout plan
-
Choose 3–5 critical scenarios. Usually these are login, search, request creation, approval, and report export. One scenario should be end-to-end, from first click to result.
-
Describe events step by step in plain language: what the user did and what happened next. A good check: you should be able to reconstruct the path from events without reading texts or knowing the user.
-
Add form error and technical failure collection. For forms record error type (validation, required, wrong format), field name and when it appeared. For failures record error code, module, response time, but not request contents.
-
Ensure reliable event delivery. Sending should work in the background, have a queue, retries and volume limits. If staff use laptops in the field or on the road, plan an offline buffer and send when connection is restored.
-
Test in staging and roll out gradually via a flag. Start with 5–10% of users, then increase. This reveals unexpected error spikes without disrupting work.
To avoid “collect-and-forget”, assign metric owners and a review cadence up front. For example, the product manager reviews weekly, and the tech lead ensures event quality.
Before enabling in production
Double-check:
- events contain no full names, IIN, document numbers, comments or any free-text fields
- there is a session or device identifier that does not directly identify a person
- errors are grouped by type, not by text that may include data
- there is a simple report: where users drop out of a scenario and how long an operation takes
Example: for a “Create service request” form, record steps (open, fill, submit), field errors and time to success. After a week you see 40% of errors in one field and median time increased after a hint change. That prompts reverting the hint and loosening validation.
Turning events into clear reports for the team
Raw events alone are not enough. Teams need answers to simple questions: where do people get stuck, what annoys them, and what will change after a fix. Build reports not “for all events” but around specific questions. In corporate systems this is crucial: there are many scenarios but limited analysis time.
Start with 2–3 dashboards, each answering one question. For example: “Where do people most often abandon the request process?” or “Which fields cause the most form errors?” Agree who reads each report and what action they will take.
A basic report usually includes a funnel by scenario steps (how many started and where they drop), step durations (median and 95th percentile), form errors by field (frequency and share of users encountering them), context breakdowns (role, device, UI version) and a short weekly “top problems” list with suggested actions.
Teams often make the mistake of relying on averages: rare but very long sessions skew the mean. Median shows the typical path; the 95th percentile highlights where a subset of users struggles. If p95 jumps after a release, that likely indicates a regression.
Evaluate changes by comparing “before and after” on the same time window and audience. Look not only at final conversion but at step drop-offs, time (median and p95), and share of users facing errors. If things are faster, have fewer errors and more completions, the change improved UX.
Common mistakes and traps in UX telemetry
Telemetry often fails not because of the tool but because of small early decisions that later produce noise, privacy risks and unused reports.
Data collection mistakes
The most common problem is “collect everything and decide later.” Without goals and an owner, events grow like weeds: one screen sends 30 click events, another sends none. After a month no one remembers why.
Even worse is capturing typed content. Users can put full names, phone numbers or IINs in comments or error messages. Suddenly telemetry becomes a repository of sensitive data.
Mixing test and production data breaks analytics: demo environments, load tests and manual checks create spikes that look like widespread user problems.
Timers are another source of error. Teams often measure “operation time” from click to server response and call that user speed — but that’s mostly network and backend. For UX it’s better to separate wait time, input time and time spent fixing errors.
Short list of what usually ruins collection:
- events without goals, metrics or an accountable owner
- recording text from fields, comments or raw error messages
- mixing test and production events without clear environment labeling
- “flat” timers that don’t separate system wait from human action
- overly precise identifiers (for example, personnel numbers in plain text)
Interpretation and governance mistakes
Even good data is useless if it doesn’t lead to decisions. A common scenario: a report shows many returns at step 3 but no backlog items are created.
Typical blockers are simple:
- reports for the sake of reports: no rule on who decides based on metrics
- no thresholds: unclear what counts as a problem (5% or 25% errors?)
- no post-fix verification: a form is fixed but nobody measures whether it got better
Example: form errors of type “wrong format” are increasing, but telemetry lacks context (which field, input type, step). Teams argue. If events store only the field key and error code (without values), the issue becomes clear and a task can be defined in 10 minutes.
Quick checklist before launch and after release
Before launch
Agree on the goal before enabling telemetry. Otherwise you’ll collect many events and the team won’t get answers. Identify the 3 key scenarios (e.g. create request, approve document, find a client) and the signals that will show the UI improved.
Check before start:
- 3 key scenarios and success metrics are chosen (completion rate, time, form error rate)
- event catalog is documented and agreed: names, parameters, schema version and owner
- events contain no user input or document content: no field text, comments or file fragments
- sessions are pseudonymous and reports are available by role or department without personal ties
- retention periods, access rules and auditing are defined
This check usually takes less time than investigating an incident where extra data accidentally ended up in analytics.
After release
Telemetry produces value only with a regular analysis ritual. Appoint a short weekly review: 30–45 minutes, one dashboard and a list of actions.
In the first 1–2 weeks check:
- metrics don’t jump due to technical issues (duplicate events, gaps, wrong timers)
- form errors are grouped by type and location, not lumped into one counter
- there’s a prioritized list of improvements with dates for verification
- the team shares a common understanding of terms and event meanings
A practical guideline: at least one small UI fix based on data should appear every week.
Example: improving a request form using clicks and errors
Scenario: an employee starts a request (e.g. for equipment or access) but often abandons it mid-way. Support hears complaints, and the process owner only sees the end result: fewer requests than expected. Telemetry helps because it shows actual sticking points, not opinions.
What events show when collected properly and without extra PII:
- form step (e.g. step 1 of 3) and screen id
- field where an error occurred (only the field key, not the entered value)
- error type (empty, wrong format, failed validation)
- time on the step and server waiting time
- action before leaving (click Back, close, retry)
On a dashboard this becomes a funnel: opened form -> completed step 1 -> step 2 -> submit. Suppose 40% drop off at step 2, and among those who continue 70% get an error in the IIN/BIN or “Contract number” field. The error type is often format_invalid, and median time on the step grows to 90 seconds due to repeated attempts.
Hypothesis: users don’t know the expected format and validation is too strict. For example, the field only accepts digits without spaces but users enter numbers with spaces or dashes, as in paper documents. Or the error message is generic (“Invalid”), so people don’t know what to fix.
A small targeted change fixes this: add a hint by the field, enable an input mask (so spaces and separators are handled automatically), and change the error text to a concrete instruction ("Enter 12 digits only"). Keep server-side validation but do client-side checks earlier so users don’t wait 2–3 seconds per attempt.
Measure the fix as specifically as the problem: compare funnel conversion before and after (especially step 2 -> submit), the share of errors by field and error type, p95 time to submit (not just the mean), and ensure retries and support requests didn’t increase.
If p95 decreases and the drop at step 2 falls, the change helped — and you can prove it with numbers without collecting field contents or turning analytics into PII storage.
Next steps: pilot, improvement cycle and implementation support
Start with a small pilot. Pick one module and one process where the pain is clear and measurable: request submission, catalog search, document approval. The narrower the scope, the faster you’ll see results and the easier it is to explain them to the business.
Before launch, agree simple data rules: what you will collect and what you will never collect. That saves weeks of debate and reduces the risk of accidentally recording sensitive data.
Minimal 2–4 week pilot plan
Gather product, UX and development and agree a basic set of steps:
- describe the goal and metric (e.g. reduce form error rate by 20% or cut operation time by 15%)
- approve a data policy: no full names, no field text or document content, only technical events and context
- mark key events in one process and add a couple of timing checkpoints (start, successful end, cancel)
- set up a dashboard or simple report and appoint an owner to summarize weekly
- plan one small UI change and the criterion to measure improvement
Then follow a regular cycle: detect anomalies, form a hypothesis about what blocks users, implement a fix and verify it using the same metrics.
Example: in the pilot the division-selection step shows many repeated clicks and takes over a minute. Hypothesis: the list is too long and search isn’t obvious. Add a visible search box and hint, then compare step time and cancel rate before and after.
Infrastructure and security without surprises
Estimate load in advance (peak hours, number of workplaces), retention and access. Logs and events must be protected like other corporate data: role-based access, auditing, encryption, and separate test and production environments.
If telemetry is part of a broader infrastructure update (workstations, servers, monitoring contours), integration can simplify the project. For example, GSE.kz as a manufacturer and system integrator in Kazakhstan can help design a secure event-collection contour and choose infrastructure for corporate load with ongoing support and maintenance.
FAQ
How is UX telemetry more useful than user complaints and support tickets?
UX telemetry shows exactly where a user gets stuck in the interface — which screen, which step, and how it ended. That reduces blind support tickets like “it doesn’t work” because the team gets facts about clicks, errors and operation times.
Which scenarios are best to start telemetry collection with in a corporate system?
Start with 3–5 critical scenarios that are used most often: login, search, creating a request, approval, exporting a report. Measuring only rare features yields little data and little impact.
Do I need to collect every click to understand user behavior?
You only need events that describe the meaning of an action: screen opened, form submit attempt, success, cancel, or back navigation. Recording every click usually creates noise and overloads reports, so capture key scenario points only.
How should I collect form errors so the data is useful and not garbage?
Collect the fact of an error and its type, not what the user typed. Typically you need the field identifier, error category (e.g. `required` or `format`), attempt number and form step — that’s enough to see where people stumble and what to fix in hints or validation.
How to measure operation times to distinguish UX issues from performance problems?
Record operation start, end and status separately, and store durations in milliseconds. This lets you separate system/network latency from user actions and quickly spot timeouts and retries.
What data must not be collected in UX telemetry to avoid gathering extra PII?
Do not send full name, phone, email, IIN, comment text, field contents or files. If you need context, use anonymized attributes like role, device type, UI version and a random session identifier with a short lifetime.
What is the minimal event schema for UX telemetry?
At minimum: a random `session_id`, `event_name`, `screen_id`, event timestamp and UI version. Add one or two meaningful parameters like `status` and `duration_ms`. That’s usually enough to build funnels, see returns and compare before/after a release.
How to keep data comparable when the UI changes frequently?
Include `ui_version` and `schema_version` so reports don’t break when the interface or event format changes. If you use feature flags or experiments, record them as separate parameters to keep comparisons valid.
Who inside the company should see telemetry data and in what form?
Engineers need raw events for debugging, while product and UX need aggregates: funnels, medians, p95 and top field errors. Restrict raw-event access by role and retention time to reduce risks and avoid turning analytics into an endless raw log.
Can UX telemetry be integrated into a broader IT infrastructure upgrade?
Yes — telemetry is often implemented together with wider IT updates. GSE.kz, as a manufacturer and system integrator in Kazakhstan, can help design a secure event collection contour and choose infrastructure for corporate load, including ongoing support.