Testing PC Power Consumption and Heat for Procurement
Testing power consumption and heat on a pilot batch: how to measure in the office, compare models and present numbers to justify procurement.
Why measure power and heat on a pilot batch
Power and heat measurements on a pilot batch help make decisions that are hard and expensive to fix later. If 10–20 PCs operate “on the edge,” on hundreds of desks this becomes overheated rooms, constant fan noise, employee complaints and unexpected electricity bills.
Specification numbers often don’t match office reality. Manufacturers usually list figures measured in controlled conditions: clean airflow, fresh thermal paste, a single load scenario and stable ambient temperature. In an office there is dust, dense placement, background tasks (antivirus, backups), different user habits and sometimes poor ventilation in a cabinet or under a desk.
What decisions depend on power and temperature
These measurements directly affect procurement and operations. You verify how much power headroom is needed, how ventilation‑sensitive a model is, whether the office will be noisy, how to choose a UPS and what the ownership cost will be (electricity, air conditioning, maintenance).
IT cares about stability and lifespan: less overheating means fewer failures. Health and Safety teams care about temperature, noise and comfort. Finance needs predictable monthly expenses and no hidden cooling, UPS or unexpected replacement costs.
What you can learn without an expensive lab
Even in a regular office you can get results sufficient for a buy/don’t‑buy decision and to justify procurement. For example, if one configuration consumes 20–30 W more under a typical load and runs hotter, over 200 workplaces that becomes a noticeable difference in bills, cooling needs and noise levels.
What to prepare before the test: scope, conditions, roles
To keep the test fair, start with the pilot size. One PC can show “perfect” numbers, but batches include variations in power supplies, fans, thermal paste and BIOS settings. It’s more important to look at the spread across several identical units than to rely on a single result.
For office procurement, 5–10 PCs per typical workstation configuration is usually enough. If you have different use cases (e.g., accounting and designers), take 3–5 PCs for each type. That way you see the average and the “worst case,” which matters for power and comfort.
Next — conditions. Small things can spoil measurements in an office: different outlets, extension cords, cramped space under a desk, dusty niche. Choose one zone where you can repeat the same connection and placement. Record whether the system unit is under the desk or on top, how much free space surrounds it and how air flows.
Before starting, write down exactly what you want to confirm before procurement. Don’t limit yourself to “it shouldn’t overheat.” Agree on measurable parameters and output format up front: which modes to test (idle, typical work, peak), which metrics to record (power, temperature, noise, fan behavior), what conditions count as acceptable and what will be considered a problem. This makes it easier to turn results into procurement and acceptance requirements.
Define roles in advance. IT sets up systems, load scenarios and collects data. The office manager helps ensure identical workstations and minimal disturbance. Health and Safety is useful if noise and heat affect working conditions. Involve procurement early: if they approve the methodology and criteria before testing, you won’t have to “prove the obvious” later.
Tools for the office: what’s essential and what’s optional
In office measurements repeatability matters more than “perfect instruments”: identical conditions, identical scenarios and clear data recording.
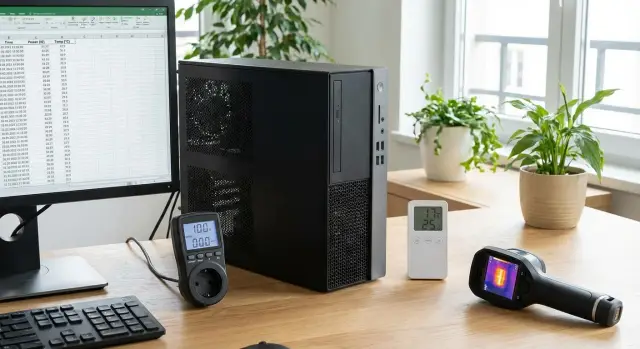
A minimum kit usually suffices:
- a plug‑in wattmeter (instantaneous W, accumulated energy kWh, peak during the test)
- a simple room thermometer/hygrometer
- utilities for load and monitoring (CPU, GPU if present, RAM, storage)
- a single spreadsheet or template for recording results
With the wattmeter record at least three points: “idle” (after 10–15 minutes from login), “typical work” and “peak” (short stress test). In addition to W, note kWh over a fixed interval, e.g., 1 hour of typical load — that’s easier to convert into money.
Component temperatures are easiest to capture from monitoring utilities: CPU package, GPU (if present), SSD temperature. Also record room conditions in parallel. The same PC in a stuffy room will look notably worse, and that isn’t always the PC’s “fault.”
A sound meter is optional but can settle disputes. If you don’t have one, agree on a consistent subjective method: the same distance (e.g., 50 cm), the same background (closed door, no music) and a short scale like “quiet/noticeable/disruptive.” The key is consistency.
In your table, define clear columns: model and serial number, date and location, room temperature/humidity, test mode, average and peak power, kWh for the interval, maximum CPU/GPU/SSD temperatures, and notes (throttling, sudden noise increase, reboots).
Load scenarios: which modes to simulate in the office
To be fair, loads should reflect a typical workday, not only “laboratory maximums.” Run the same scenarios on all pilot devices and record exactly what was running.
Idle
Start the idle measurement not immediately after boot but 10–15 minutes after loading. By then background updates, indexing and antivirus scans usually finish. This window shows how “calm” the system is: extra processes often raise both consumption and temperature.
Typical office work
Recreate an average user day: a browser with 10–15 tabs, email, a document (editing and searching) and a short video call. Video calls are often an unexpected source of heat (camera, codecs, noise suppression), so include them in the mandatory scenario.
Use the same timing for each PC so comparisons are fair. For example: 10–15 minutes idle after warm‑up, 20–30 minutes office mix, 10–15 minutes video call, 10–15 minutes short peak load and 45–60 minutes long stability load.
A peak load isn’t about records but about quickly checking cooling: how fast does temperature rise, does noise spike, do frequencies drop. A long load shows whether the PC holds a stable temperature or “drifts” over time.
Also test a configuration with two monitors and typical peripherals (keyboard, mouse, headset, USB printer). Two displays and an active headset can noticeably change consumption and fan behavior, especially in compact systems and all‑in‑ones.
Step‑by‑step measurement method: from power‑on to finalizing results
Start with identical conditions and a consistent data header. Record date and place, room temperature, model and serial number, configuration (CPU, RAM, storage, PSU), OS version and key power settings.
After power‑on allow 10–15 minutes for stabilization so updates and background tasks finish. Don’t install apps or change configuration during the test if possible.
Follow a single route for comparability:
- Warm‑up and check that the system isn’t updating or scanning disks.
- Idle: 10 minutes. Record average and peak consumption, CPU (and GPU) temperature and fan speeds.
- Typical work: 30 minutes in your office scenario. Log averages/peaks and noise notes.
- Short stress: 10–15 minutes. Watch maximum temperature, clock speeds and signs of throttling.
- Cool‑down: 5 minutes without load to see how quickly the system returns to normal.
Record identical summaries for each unit. One summary row per PC is usually enough: average and peak in idle, average and peak in typical work, maximum temperature, whether throttling occurred and a short noise comment (e.g., “quiet on calls”, “noticeable whine under load”). These notes help explain numbers to non‑technical stakeholders.
How to collect data so procurement and management accept it
To make the pilot results credible, enforce uniform recording rules and a clear evidence base. Then measurements turn from “user impressions” into a document you can rely on.
Keep one spreadsheet for the whole pilot and don’t change its format mid‑test. It’s convenient if one row equals one measurement at a fixed interval (for example, every 30–60 seconds). Predefine durations for each scenario: 10 minutes idle, 15 minutes office load, 10 minutes peak. This keeps comparisons fair.
Fields that can be verified are enough: date/time, model/serial, location, scenario and conditions (brightness, network), average W and W peak, kWh for the scenario, CPU/GPU/SSD temperatures, plus notes on noise and events that may have skewed the measurement.
Don’t hide anomalies — mark them. If an OS update, antivirus scan or network spike occurred during a test, note the time. Management prefers an honest explanation to a perfect chart.
Store artifacts for each PC and scenario in one folder: screenshots of monitoring tools showing temps and clocks, logs (if exportable), photos of the wattmeter at start and at peak, and a short configuration card (OS, power plan, driver versions).
For procurement, add a one‑page summary: kWh per day/shift, peak temperatures, notable remarks. This helps convert measurements into procurement and acceptance requirements.
How to interpret results: energy, heat and practical conclusions
After measurements, don’t just compare numbers — understand what they mean for your office. Results are useful when translated into risks, employee comfort and money.
Context sets the norm: room temperature, dust level, presence of air conditioning and work schedule (8/5 or shift). For offices it’s usually enough to look at stability: consumption and temperature should not keep rising over 30–60 minutes of load and after multiple sleep/wake cycles.
Signs a model may be problematic
Watch behavior over time, not a single peak.
- temperature rises stepwise and does not reach a plateau under the same load
- performance drops for the same task (sign of throttling)
- the fan suddenly goes loud without clear reason, even at idle
- identically configured PCs differ noticeably in consumption for the same scenario
If one PC behaves differently, it may be a defect, poor cooling contact or a different BIOS/power profile.
Converting to annual and budget numbers
To convince procurement, convert W to kWh and then to tenge. A practical formula is simple: average power during working hours multiplied by hours and days.
- kWh per year per PC = (average W / 1000) × hours per day × working days
- for a department = per‑PC result × number of seats
- for the whole fleet = per‑PC result × total PCs
Add electricity cost. If air conditioning is used, note that extra watts become heat. Hotter PCs often mean more noise and higher load on room cooling.
For a fair comparison keep scenarios, components (RAM, SSD, PSU, discrete GPU), power settings and placement identical (cubby under desk, proximity to wall, direct sunlight). Then differences reflect the model, not random conditions.
Common mistakes and traps in office measurements
The most common mistake is testing a single “convenient” PC and judging the entire batch by it. Even identical models can behave differently because of component variance, BIOS/power settings and workplace conditions. For a pilot, test multiple devices and repeat key measurements consistently.
Another trap is comparing results taken at different times and conditions. A test in a cool morning room and one in a warmed‑up evening room give different temperatures and noise, and sometimes different power draw due to fan behavior. When comparing PCs, place them in comparable spots and record room temperature.
Also don’t ignore peaks while focusing only on average consumption. Peaks matter for UPS selection, power groups and risks when updates, antivirus or heavy reports run simultaneously. Show both average and maximum for each scenario.
Don’t forget the whole workstation energy balance: monitors, docking stations and chargers may be significant. Two seemingly equal PCs can differ because one is paired with a more power‑hungry monitor, raising the per‑workstation number.
Separate air temperature and component temperature. “The room is 24°C” doesn’t guarantee CPU or drive temperatures are fine. In the report separate: room conditions (temperature, ventilation, placement) and component temperatures under load.
Finally, avoid an uncontrolled “max stress” test. If you shove a PC into a closed cabinet and run an hour‑long stress test, you can produce overheating and noise that don’t reflect normal use or even cause shutdowns. Ensure intake and exhaust aren’t blocked, no nearby heat sources, and keep stress durations limited and observed.
Short checklist before the test and before the report
To make procurement and management trust the numbers, eliminate randomness: different conditions, tasks and recording rules.
Before the test
The pilot must be comparable. Fewer devices measured consistently is better than many measured inconsistently. If you compare alternatives, test them under the same conditions.
- Take 3–5 identical PCs per configuration and 1–2 variants for comparison.
- Record conditions: room temperature, placement (under desk/on desk), presence of tight niches.
- Approve identical scenarios and durations for all devices.
- Prepare a recording form: who measures, when and where results are stored.
- Agree stop‑factors: what counts as a problem and what to do if one appears.
Before the report
A strong report links measurements to procurement criteria: total cost of ownership, office comfort and overheating risks.
- Ensure each PC has average W, W peak, kWh, temperatures and short noise notes.
- Consolidate results into one table with consistent labels (model, configuration, location, scenario, duration).
- Translate numbers into conclusions: kWh/day/month per workstation and what that means for 20/200 seats.
- Call out deviations and causes (room heat, dense placement, OS updates during the test).
- Formulate procurement requirements: consumption range, maximum temperatures, noise and installation rules.
If considering domestic PCs (for example, GSE.kz) and alternatives, present comparisons under the same logic: identical scenarios, conditions and criteria.
Example: a 20‑workstation pilot and procurement justification
Scenario: a 20‑seat office replaces old PCs that run hot and noisy. Procurement wants numbers showing new PCs will be more economical and not create discomfort in the open space.
Select 2–3 models (e.g., different office PC and all‑in‑one configurations), two samples of each to see spread. The goal is honest measurements under typical tasks, not record stress tests.
A 5‑day plan helps keep conditions comparable:
- Day 1: identical image, drivers and power settings, 30 minutes idle measurement.
- Day 2: office apps and browser for 2 hours, record every 15 minutes.
- Day 3: 1 hour of video calls plus documents, notes on noise and temperature.
- Day 4: department‑specific tasks (1C, CRM, medical system, training), gather feedback.
- Day 5: repeat key measurements at the same locations, check deviations.
One responsible person (IT or facilities engineer) records measurements and a second person confirms time, place and scenario. This reduces questions about human error.
Keep the final table short: model, scenario, average consumption (W), peak (W), maximum key sensor temperature, noise rating (quiet/noticeable/disruptive) and spread between samples. The spread (e.g., one unit much noisier) often becomes the main argument about batch risk.
Write the procurement justification without excessive technical detail: “Model A was chosen because at equal office performance it consumes X% less and stays within the agreed noise level; the spread between two samples is minimal, reducing batch risk.” If comparing a local vendor, note support and service as factors that reduce downtime. For example, GSE.kz as a systems integrator and local manufacturer covers supply and support, which is convenient for large organizations.
Attach a one‑page summary, test conditions (place, time, temperature) and a 5–7 line conclusion with numbers and assumptions to the procurement note.
Next steps: turning measurements into procurement requirements
After the pilot don’t leave numbers in a spreadsheet. Turn them into requirements that can be included in the spec and verified at acceptance.
Define thresholds tied to office reality: are power lines sufficient, will it be hot in summer, how audible are fans in quiet rooms. In procurement it’s better to set acceptable ranges rather than “ideal” values.
Typical conversions to requirements:
- Energy: average consumption in typical work and allowable peaks under load (so breakers don’t trip and bills don’t spike).
- Temperatures: maximum CPU/GPU and chassis temperatures under specified office conditions, with margin for summer.
- Noise: maximum level in normal work and during short load periods (important for open offices and private rooms).
- Configuration: exact components and delivery parameters without “equivalents.”
Also fix operating conditions in the spec: office temperature range, placement rules (no closed cabinets), dust cleaning frequency and UPS requirements if they affect stability.
Request supplier confirmation of configuration stability: what will be in the series batch, how component substitutions are handled and how they affect power and heat.
For government and quasi‑government buyers, check local content and service requirements in advance. If local supply and support matter, discuss with GSE.kz appropriate office PC L200 configurations, GSE M200 all‑in‑ones or S200 servers tailored to your rack and cooling.
FAQ
How many PCs should be included in a pilot to get reliable measurements?
Usually **5–10 PCs per typical workstation configuration** are enough to see the average and spread. If you have different scenarios (e.g., accounting and designers), take **3–5 PCs for each type**, otherwise you risk drawing conclusions from a “lucky” unit.
Which load modes must be run in an office test?
Start with three modes: **idle after warm‑up**, **typical office work** and a **short peak** to check cooling. That is enough to understand real consumption, heat and noise risk, and then turn results into requirements for UPS, power and placement.
Why not measure consumption right after turning on the PC?
Allow the system **10–15 minutes after boot** so updates, indexing and background scans finish. Measuring immediately gives inflated W and temperatures and you’ll end up comparing not models but “who was updating when.”
What tools are really needed to measure W and temperature without a lab?
At minimum you need a **plug‑in wattmeter** and a clear recording table. CPU/GPU/SSD temperatures are easiest to capture with monitoring software, and room temperature can be measured with a simple thermometer so you don’t confuse room ventilation issues with a specific model problem.
Which is more important to record: W or kWh, and why?
Record not only instantaneous W but also **kWh over a fixed interval** in a typical scenario (for example, per 1 hour). kWh is easier to convert into money and compare models across a large fleet: you immediately see the operating cost, not just a momentary reading.
How to correctly compare two PCs if one is slightly more efficient but has higher peaks?
Keep scenarios, measurement times, placement and power settings identical, and record **average W and W peak** in the table. Peaks matter for procurement because they affect UPS and circuit sizing and represent risks when many PCs start heavy tasks simultaneously.
What signs in the data suggest a model will overheat in real use?
Look at behavior over time: if temperature rises and does not reach a plateau at the same load, that’s a warning sign. Also check whether performance drops under the same task — a common sign of throttling and cooling or configuration issues.
What to do if one PC in the pilot shows very different numbers?
First, repeat measurements in as comparable conditions as possible and note room temperature, PC placement and background events. If one unit differs significantly in W, temperature or noise under the same scenario, it may be a defect, a different BIOS profile or a cooling contact issue — record and retest that unit separately.
How to assess noise if there is no sound meter?
Without a meter, agree on a consistent method: the same distance from the PC, the same background noise and a short rating scale, so you avoid arguments about “seems loud/doesn’t seem loud.” For procurement, repeatability matters more than precision: a rough but consistent method is better than inconsistent subjective estimates.
How to turn pilot results into requirements for specifications and acceptance?
Translate results into checkable acceptance criteria: allowed average consumption in typical work, allowed peaks, maximum component temperatures under specified office conditions and expected noise levels. If you consider a local vendor like GSE.kz, ask about configuration stability in series production and how service will be provided so pilot numbers match the delivered batch.