Synthetic Infrastructure Monitoring: Checks Without the Noise
Synthetic infrastructure monitoring lets you run scheduled DNS, VPN, RDP and HTTP checks to separate network failures from service issues and reduce alert noise.
Problem: alerts exist but it's unclear what actually broke
Almost every company sees the same pattern: notifications keep coming all day, but the real outage is only noticed after users complain. The reason is simple: many alerts monitor “internal” signals (CPU, log errors, process crashes), while users need a clear answer — can they open and log into the service or not.
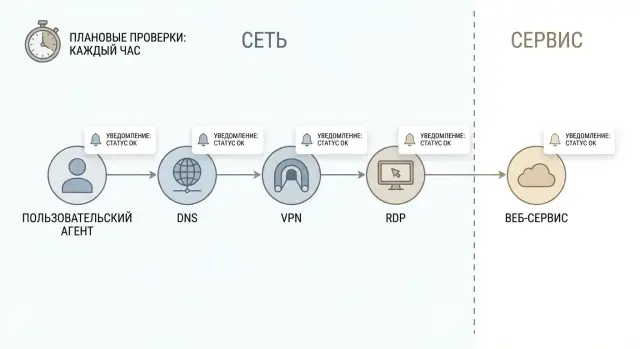
Synthetic infrastructure monitoring fills that gap. It runs short, user-like actions on a schedule and records the result. For example: was a DNS name resolved, did the VPN tunnel come up, is RDP accessible, does the site return HTTP 200 and how long did it take. This is not a replacement for metrics and logs, but an independent external check even when the application itself reports “everything is fine.”
“Noise” in alerts are messages that don’t require action or don’t help diagnose the cause. The danger is obvious: the team gets used to ignoring notifications and important events get lost among false positives. Time is wasted and the risk of missing a real incident grows.
Well-configured synthetic checks help quickly answer key questions and narrow the investigation:
- Is it the network or the service?
- Is the problem DNS, routing, port access, or the application?
- Is the outage local (one site or ISP) or global?
- When did it start and how has latency changed?
A simple example: users can’t open a corporate web service. If DNS doesn’t resolve — that’s one branch. If DNS is fine but HTTPS won’t establish — that’s another. If HTTPS responds but returns 500 — it likely points to the app or database. Such a breakdown saves hours of back-and-forth between network engineers and service owners.
What to check on schedule: DNS, VPN, RDP, HTTP with simple tests
The point of scheduled checks is to simulate the user’s path: from name to service and back. Then synthetic infrastructure monitoring shows not just “port open”, but exactly where the failure starts — in the network, in access, or in the application.
DNS is best checked not by a single query but by a short chain: resolving the needed names (A/AAAA, CNAME), response time and error type. NXDOMAIN usually means a typo or wrong record. SERVFAIL more often points to an issue with the DNS server or its recursion. It makes sense to test internal zones (for example, intranet.local) and external domains if the service is publicly available.
Check VPN like a user: gateway reachability, successful authentication and tunnel establishment time. If the gateway pings but the tunnel takes long to come up or never does, that’s not “just the network.” Frequent causes are certificate issues, account problems, hub overload, or access policies.
For RDP, checking port 3389 is not enough. It’s important to reach the actual login screen and measure time to it. Sometimes the port responds but the service is hung, licenses are exhausted, the domain controller is unreachable, or the profile is stuck — the user still can’t log in.
For HTTP/HTTPS do the check “like a browser”: status code, redirects, time to first byte (TTFB), TLS validity and certificate expiry. The difference between 200, 302, 401 and 503 already hints at what’s broken.
A practical set of basic tests (record status and timing for each):
- DNS: resolution + error type (NXDOMAIN/SERVFAIL) + latency
- VPN: handshake/login + tunnel establishment time
- RDP: TCP + appearance of the login screen
- HTTP/HTTPS: status code + TLS + redirect chain + TTFB
- End-to-end step: run all steps in sequence from name to a specific URL
An end-to-end test is especially useful: if it fails while individual checks are green, the issue is often in the chain — routing, proxy, ACLs, load balancer or an external dependency of the application.
Where and how often to run checks so the picture is honest
For synthetic infrastructure monitoring to reflect reality, it matters not only what you check but also where from. The same service can be reachable from a data center but unavailable from an office due to ISP, routing or corporate access rules.
Start with 2–4 probe points that reflect real traffic paths: an office network (like employee access), the data center (like internal systems), an external point closer to customers (like internet users), plus a major branch or a problematic region.
Frequency depends on downtime cost and tolerance for flapping. For critical things (VPN login, main web service) 1–5 minutes is usually enough. For secondary checks (backup channels, non-critical zones) 15–60 minutes is often sufficient. Simple rule: the more costly the downtime, the more frequent the checks.
Schedule maintenance windows in advance. During those windows alerts should be disabled or switched to "informational only" to avoid a flood of false incidents that would train the team to ignore notifications.
Set timeouts strictly. If an HTTP check hangs for 2 minutes, frequent runs lose meaning and queues build up. Typical guidelines: DNS 2–3 seconds, VPN/RDP 10–20 seconds, HTTP 5–15 seconds. Then add 1–2 quick retries so a single transient network glitch doesn’t create an alarm.
Step-by-step: how to build scheduled checks from simple steps
Start by describing the real user path, not just “check the port.” For example: an employee connects to VPN, opens RDP to a work server and accesses an internal portal. This scenario immediately shows where a bottleneck might be.
Then break the path into stages that can be checked separately. A useful logic: DNS — network — TLS — HTTP — authentication. Each stage should give a clear outcome: an accessibility issue, a routing problem, a certificate issue, or an application error.
Building checks step by step
A skeleton to start from:
- Fix input data: hostname, IP (if static), port, URL, test user.
- Make separate checks: DNS resolution, TCP reachability (SYN), TLS handshake, HTTP response, login or role check.
- For each step record result and timing (success, timeout, refusal, unexpected status code).
- Add minimal context: which DNS server, which IP returned, which HTTP code, which certificate.
- Combine steps into a single scenario but keep per-step detail.
Timing per step and baseline
Measure time separately for DNS, connection and service response. Then “slow” becomes a signal, not a mystery.
After setup run checks during work hours and at night. If nights are stable but daytime shows rising DNS or TCP times, the cause is often the network or overloaded border devices. If DNS and TCP are quick, TLS succeeds but HTTP returns 500 or auth fails, the issue is more likely the service.
Example: the portal won’t open. The test shows DNS sometimes returns different IPs and resolution time jumps, while HTTP to a “good” IP is fast. That means start with DNS and routing rather than the application team.
How to separate a network issue from a service issue
The main principle: test the chain step by step and record exactly where it breaks. Then instead of arguing “network” vs “application” you have a fact: which stage failed.
Keep a simple order: name, then path, then service. If the name doesn’t resolve there’s no point in probing HTTP or RDP. If the name resolves but there is no connectivity to the address, the problem is likely network or routing. Only when the path is alive does it make sense to dig into the service.
A diagnostic chain that almost always works:
- DNS: the domain returns the expected IP and doesn’t jump for no reason
- Network: there is connectivity to the IP or gateway (latency and loss in normal range)
- Port: the required port is reachable (443 for HTTPS, 3389 for RDP, etc.)
- Scenario: the service behaves as expected (login, API response, page load)
To find the failure faster, compare different DNS views: internal (how staff and servers see it) and external (how the internet sees it). If external resolves but internal doesn’t — responsibility is almost always local infrastructure. If the reverse is true, the issue may be an external DNS provider or publication.
Another reliable trick is parallel HTTP checks from multiple points. If the office can’t open it but the data center can, suspect corporate VPN, firewall or routing. If nobody can open it, the web service or its dependency (DB, load balancer, certificate) is likelier the cause.
Don’t confuse “port is open” with “service works.” RDP may listen on 3389 but logins can fail due to policy, overload, hung profiles or an unreachable domain controller. So after checking the port add a scenario check: establish a session, reach the login screen, perform a test login (or at least observe the expected response).
To hand off incidents without extra questions, include three things in each alert: which step failed (DNS, network, port, scenario), where the check was run from (point, subnet), and what was observed (HTTP code, timeout, wrong IP). That routes the notification to the correct team right away.
Thresholds and rules to keep alerts low-noise
Alert noise often appears because all events are treated equally. For synthetic checks it’s useful to separate two signal types: latency and errors. They behave differently and need different thresholds.
An HTTP may return 200 but take 8–10 seconds. That’s painful for users but not always an outage. Three consecutive timeouts or a series of 5xx responses more often indicate real unavailability.
A working pattern is two levels: warning for degradation and critical for unavailability.
Minimal ruleset that removes most noise
- Separate thresholds for latency and for errors.
- Different conditions for warning and critical (warning = slow, critical = not working).
- Require confirmation: alert after 2–3 consecutive failures, and recovery after 2 successful checks.
- Suppress repeats: one incident per problem, not dozens of identical messages.
- Respect maintenance windows: disable critical notifications or make them informational during planned work.
How it looks in practice
If a VPN check times out once but the next succeeds, record the event but don’t wake people at night. If three checks in a row can’t establish a tunnel and DNS and HTTP from another point also deteriorate, it’s likely a network problem. If the network is healthy but RDP to one host fails, it’s likely a service or host-specific issue.
The goal is not to “monitor less” but to make alerts match real incidents.
Notifications and escalation: how to not lose important alerts and not overload people
Even the best synthetic checks are useless if alerts go to the wrong people or are unclear. One signal should indicate who takes it and where to start.
Split recipients by failure type:
- Network (DNS, VPN, RDP, loss, timeouts) — network duty or NOC
- Security (certificate failures, blocks, suspicious responses) — SOC or security owner
- Application/service (HTTP 5xx, login fails, API errors) — app on-call or service owner
- Platform (load balancer, proxy, SSO) — platform team
- Provider/channel (confirmed from multiple points) — vendor or carrier owner
Notification channel should match the risk. Chat messages suit “one probe point is flaky” or “unstable but service alive.” A phone call is needed when there’s clear downtime or SLA risk: multiple points confirm failure, a critical service is affected, or SLA is threatened.
To avoid the “where is it broken?” back-and-forth, include at least these fields in each notification:
- probe point and network (office, data center, external node)
- scenario step (DNS, TCP, TLS, HTTP, login) and where it stopped
- error code or text (NXDOMAIN, timeout, 401, 502) and measured time
- observation window (how many consecutive checks) and time of first failure
- current escalation status (L1, L2) and contact on duty
Escalation by time should be predefined. Example: 0–5 minutes confirmation by on-call, 5–15 minutes escalate to second line, 30 minutes notify service owner. If an issue is not confirmed, mark it as a flap and review thresholds and probe points instead of permanently silencing the check.
Example scenario: “corporate web service won’t open”
Morning: users say “the portal won’t open over VPN.” If you react only to a single “site down” alert you can waste an hour arguing whether it’s the network or the service.
Scheduled checks run the chain: DNS, then VPN, then node reachability on the required port, and only then HTTP. In our example the picture is: the portal name resolves, the VPN tunnel comes up, basic network reachability exists, but HTTP returns 502.
502 usually means you reached the web endpoint but something inside is wrong: load balancer, upstream, backend pool, limits, intermediate proxy. Important conclusion: the network is alive — investigate the service or the load balancer. Synthetic infrastructure monitoring reduces noise by giving you the specific layer that failed rather than everything turning red.
Counterexample: the same checks run from HQ and a branch. From HQ DNS responds, but from the branch DNS doesn’t respond or resolves the wrong address. The HTTP test never starts because there’s no IP. This looks like a local issue: the branch DNS server, firewall rules, split-DNS, cache, or VPN policy for that subnet.
To quickly hand the task to the right team, prepare a short summary: who can’t open it and where, what was checked (DNS -> VPN -> port/route -> HTTP), where it failed (exact step and code), which key facts are green, and why this points to network or to the service.
Common mistakes in synthetic monitoring
The most common mistake is to rely on ping and be satisfied. Ping shows a host responds somewhere, but tells almost nothing about DNS, authentication, certificates, web page availability or VPN operation. The result: green checks but users still can’t access the service.
Another typical problem is running checks from only one point, e.g. the data center. Then you won’t see that a remote branch has ISP, routing or local DNS issues. Minimum: 2–3 probe points — central network, external internet and a couple of key sites.
False failures often come from too-strict timeouts. If you give an HTTP test 1 second but the service normally needs 2–3 seconds at peak, you’ll get a stream of useless alerts. Tune timeouts based on measurements and review them periodically.
Mixing network and application alerts in one indistinguishable stream is another problem. When one notification contains “DNS didn’t resolve”, “VPN didn’t come up” and “HTTP 500”, the on-call wastes time guessing. Use simple classification: where did it fail — resolution, channel, port, login, or service.
Finally, many teams don’t store measurement history. Without it there’s no baseline of “normal” and gradual degradation over weeks can go unnoticed.
Quick checklist to avoid most mistakes:
- Keep separate tests for DNS, TCP port, login (VPN/RDP) and HTTP.
- Run checks from at least two different networks.
- Set timeouts based on real measurements and review them.
- Separate events by type: network vs service.
- Store history and use it as the baseline for thresholds.
Quick checklist before going to production
Before enabling synthetic infrastructure monitoring for everyone and waking on-call staff, verify basic things. This takes an hour or two but saves days of troubleshooting later.
First, define the “critical user paths.” Not just “VPN works” but specifically: “an employee connects to VPN, opens RDP to the terminal server, and accesses the HTTPS web service.” Each path should have a service owner and a network owner so alerts don’t float unanswered.
Then break each path into steps and expected results: DNS returns the expected record within X ms, VPN comes up within Y seconds, RDP reaches the login screen, HTTP returns 200 and the login page, redirects go where expected. Predefine timeouts and acceptable response times, otherwise checks will be either too nervous or too silent.
Pre-production checklist:
- Critical paths agreed and owners assigned (service, network, security).
- For each step define expected results: codes, timeouts, acceptable durations.
- Checks run from at least two points (e.g. office and external network).
- Alerts require confirmation: trigger only after N consecutive failures and suppress repeats.
- Alert is readable: which step failed, from where, what error, how long it took.
Final test: create one test incident yourself. For example, temporarily change a test DNS record or close a test port and observe how quickly and clearly the alert arrives. If the notification doesn’t help make a first decision, improve it before going to production.
Next steps: a small pilot and careful expansion
Start small. Choose 3–5 services that truly stop the business: corporate portal, VPN for remote workers, RDP to key servers, DNS resolution, one external HTTP endpoint. Pick one typical user scenario (for example, “employee from home connects via VPN and opens a web service”) and test that exact flow.
Agree in advance which metrics will feed SLA and reports. Usually it’s not “everything green” but specific metrics: percent of successful checks, 95th percentile response time, mean time to recovery. Decide how to handle borderline cases when the network is up but the service is consistently slow.
To keep the pilot from becoming scattered logs, enable result storage right away. You need history, otherwise you only see the current failure and not a two-week trend. Minimum to store: step status, duration, probe point, and error reason.
Then expand by plan, not by emotions after each incident: add 1–2 probe points in branches and at an external provider, widen scenarios (login, load a key page, API request), run checks after releases and network changes, and review thresholds monthly using collected data.
If you need a reliable base for monitoring (servers for the monitoring system, workstations for dispatchers, ongoing support), GSE.kz (gse.kz) as a manufacturer and system integrator can help with infrastructure, integration and 24/7 support so the pilot smoothly becomes an ongoing process.
FAQ
What is synthetic monitoring and why do I need it if we already have metrics and logs?
Synthetic monitoring are scheduled checks that repeat short user-like actions and record the result: whether it worked and how long it took. It complements metrics and logs because it looks at the service from the outside and quickly reveals real user-facing outages.
Where to start: which checks should I implement first?
Start with the user path: DNS resolution, network reachability to the target address, port availability, then a real scenario (for example, an HTTPS response or the RDP login screen). This order immediately shows which link is failing and reduces the “network or app” debate.
How to check DNS correctly to quickly identify the cause of a failure?
Test DNS with more than a single query: check for the expected record types and response time, and record the error type. NXDOMAIN usually means a wrong name or record; SERVFAIL more often indicates a problem with the DNS server or recursion. In alerts, include which DNS server replied and which IP was returned.
Why is ping and port check not enough for VPN and RDP?
Ping and “port open” show only part of the picture: a host may respond but a user still can’t log in. For VPN you must verify tunnel establishment and connection time; for RDP you should reach the actual login screen. These checks catch typical issues like hung services, authentication failures, or node overload.
Which HTTP/HTTPS parameters are most important to check in synthetic monitoring?
Request like a browser: check status code, redirects, time to first byte, TLS handshake and certificate validity. Status codes already guide the investigation: 200/302/401 are different cases, while 5xx and timeouts usually point to a real service problem or its dependencies.
Where to run checks from so results are realistic?
At least two different networks that reflect real traffic paths: for example, an office network and an external internet point. If needed, add the data center and one or two branch offices or problematic regions. This helps distinguish a global service outage from a local ISP, routing, or corporate access policy issue.
How often should checks run without creating too much load and “flapping”?
Critical paths often need 1–5 minute intervals to detect outages quickly. Non-critical checks can run every 15–60 minutes to avoid excess noise and load. Simple rule: the more costly the downtime, the more frequent the checks.
What timeouts and retries should I configure to avoid false failures?
Set firm timeouts so tests don’t hang and then add 1–2 retries so a single transient network glitch doesn’t trigger an incident. Practical guidelines: DNS — a few seconds, HTTP — several seconds, VPN/RDP — tens of seconds. Tune values after collecting real measurements during peak hours.
How to set thresholds and rules so alerts are low-noise?
Separate degradation (latency) from failures (errors). Use different thresholds for warning and critical. Trigger alerts only after several consecutive failures and require several successful checks for recovery to avoid flapping. Suppress duplicate incidents so one problem doesn’t generate dozens of notifications.
What must be included in an alert so it can be acted on immediately?
An alert should show three things: where the check ran, which step failed (DNS, TCP, TLS, HTTP, login) and what was observed (timeout, status code, wrong IP) with timestamps. That way it’s clear who should handle it and what to start diagnosing. Also note how many checks failed in a row and when the first failure occurred.