SNMP vs Streaming Telemetry: When to Switch and How to Pilot
SNMP vs streaming telemetry: compare accuracy, metric frequency, load and implementation complexity, and test benefits in a pilot without risk.
Why compare SNMP and streaming telemetry
SNMP has been the default way to observe networks for decades: poll a device every 1–5 minutes, get counters and statuses. The problem is that such “coarse steps” often don’t fit. Short traffic spikes, micro-losses, sudden growth of interface queues or CPU bursts easily occur between polls and remain invisible. In large networks, polling itself becomes constant background noise: requests, timeouts, retries, and varying timing accuracy.
For NOCs and service owners this directly affects SLAs and costs. If degradation becomes visible only after several minutes, an incident can impact many more users. If metrics are broken or delayed, it’s harder to prove the cause and incident analysis takes hours instead of minutes. In capacity planning, sparse measurement points also mislead: averages look fine while real peaks already hit limits.
Streaming telemetry (for example, gNMI/gRPC) changes the approach: instead of constant polling you subscribe to the metrics you need, and the device sends updates itself — on-change or at a high rate. This typically yields a smoother timeline, fewer blind spots and a faster signal for issues. The price is added complexity: you must choose data models, set frequencies and volumes, and configure ingestion, storage and processing.
Below are practical questions to close before a pilot: where SNMP already fails, what to expect for accuracy and latency, how to estimate load on devices and the network, and how much effort operations will require.
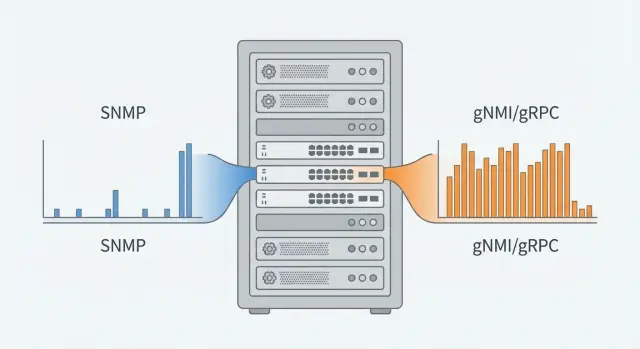
Polling vs subscriptions: what’s the difference
The main difference is simple: who initiates the data transfer.
With SNMP the monitoring system polls a set of OIDs every N seconds and receives counter values. The picture is always discrete: you don’t know what happened between polls. Traps/informs are an addition — events the device sends itself (for example, link down). But they don’t replace regular metrics and need separate setup and delivery monitoring.
In streaming telemetry (often gNMI over gRPC) you subscribe to required data (interfaces, queues, BGP, sensors) and receive a stream of updates. An important part is data models (often YANG): instead of disparate OIDs you work with paths and structured parameters.
Typical practical differences in the data include:
- Timestamps: telemetry often includes the measurement timestamp with the metric, while SNMP usually records only the poll time.
- Semantics: SNMP often relies on counters (bytes, packets) and derivatives; telemetry may send both state snapshots and counters, but in a clearer form.
- Delivery: polling treats missed requests as a “missing point”, while streams require session and buffering monitoring to avoid building a backlog during overload.
In practice both approaches often coexist. SNMP stays for inventory and basic metrics on older gear, and streaming is enabled selectively on critical nodes where fast changes and diagnostics matter.
Data accuracy: what you actually measure and what you lose
Accuracy in monitoring is not only a “correct number” but knowing which point in time it refers to.
With SNMP you see the world in “frames”: the device returns counters every N seconds, and everything between polls must be inferred. This causes distortions: short overloads are “smeared” across the interval, and some events never reach the charts.
A typical effect is peak smoothing. For example, a 10G link may hit 95% utilization for 3–5 seconds due to a backup or microburst; with 60-second polling you may see average 20–30% and wrongly conclude there is headroom.
Streaming telemetry usually provides a more accurate dynamic picture: metrics arrive at finer granularity and there’s less guessing about “what happened between”. But accuracy still depends on what the platform exports (counter, instantaneous value, aggregate) and how the subscription is configured.
Check timestamps separately. It’s important to distinguish device measurement time and collector receive time: with queues, packet loss or collector overload data may arrive later than when measured.
Evaluate pilot data quality by several signs:
- gaps in the time series, especially during peaks
- duplicates (repeated values with identical timestamps)
- time drift (device clocks vs collector)
- counter jumps (resets, overflows, unexpected zeroing)
If these are under control, you get not just more metrics but a truer picture of what’s happening in the network and on devices.
Metric frequency and detection latency
The main difference between SNMP and subscriptions is how fast you learn about a problem. Polling gives a framed view, subscriptions are near real-time. That determines whether you catch short peaks, micro-losses, buffer overflows or CPU spikes.
In SNMP practice people use 30–60 seconds for interface counters and 1–5 minutes for “heavy” metrics. Polling more frequently is possible in theory, but you quickly hit limits: device load, number of OIDs, poll cycle time, network delays and schedule drift. A 10-second SNMP cycle across a large fleet usually becomes unstable or too resource-heavy.
How streaming telemetry works
In gNMI/gRPC telemetry there are several modes that help manage latency:
- sample: the device sends values at a configured period (e.g., 1–5 seconds)
- on-change: the device sends an event only when a value changes (good for statuses, BGP sessions, links)
A mixed approach is common: some metrics by sample, others by on-change, plus occasional snapshots. This lowers latency: you see a problem within seconds rather than minutes. But frequency isn’t free: data volume and collector/storage requirements grow. Without filtering you can drown in noise.
How to choose frequency per metric
A handy rule: the shorter the harmful spike, the higher the required sampling rate. Start points:
- Interfaces (traffic, errors, discards): 1–10 seconds to detect peaks and micro-losses, 30 seconds for general health
- CPU/memory: 5–15 seconds for overload diagnostics, 60 seconds for trends
- Queues and buffers: 1–5 seconds, otherwise overflows often look invisible
- BGP and statuses: on-change plus periodic checks every 1–5 minutes
For a pilot pick 5–10 critical signals, increase frequency only for them and compare: what became visible earlier and how much did volumes grow vs current SNMP.
Load: device, network and monitoring system
Load distributes differently. SNMP “pulls” device responses, while telemetry keeps sessions and the device pushes data.
SNMP creates bursty load. The more polls and the heavier the tables (interfaces, queues, routing), the more noticeable the effect. A common mistake is a small poll interval plus collecting large tables in full. On a network device this can spike CPU and increase response latency, especially during peak hours.
Streaming usually results in steadier load but continuous. The device spends resources maintaining sessions, serializing data and sometimes buffering if the receiver lags. Overload can occur two ways: too many subscriptions or overly broad data paths without filters.
On the network SNMP looks like many small requests with burst effects: every N seconds packets go to all devices at once. Telemetry gives a steadier stream that’s easier to plan for, but is continuous and can grow fast with high sampling or many metrics.
Backend load changes too. With SNMP you pay for parsing responses and recalculating derivatives. With streaming you pay for ingesting point streams, normalization, deduplication, storage and aggregations. In a pilot, separately calculate points-per-second written and how much CPU/disk that consumes in the monitoring side.
Deployment and operational complexity
SNMP is usually easier to start: it’s available on almost any device and monitoring tools have mature polling support. Basic metrics and alerts can be up quickly without changing architecture or processes.
But SNMP has operational quirks. You must handle MIBs, correct OIDs and vendor-specific packaging. On complex devices tables can behave inconsistently (for example, interface indices changing after reboot), breaking charts and mappings.
Streaming telemetry is often harder at first. You need data models (often YANG), subscription design (paths, sensors, intervals and conditions), and ready infrastructure: where the stream lands, how it’s stored and processed, and who owns it.
What often gets easier after telemetry rollout
Once subscriptions are in place, maintaining a unified data format becomes simpler and dependence on vendor OID quirks decreases. Timeouts and retries often drop because monitoring stops polling each device on a schedule and instead accepts updates.
Compatibility and security
Before a pilot check platform support: vendor, OS version, gNMI availability and completeness of YANG models. Often advertised capabilities differ from real available paths. Some fleet parts may remain SNMP-only — hybrid setups are common.
Security-wise telemetry typically requires stricter practices: TLS, accounts and keys, ACLs and segmentation so the stream doesn’t mix with user traffic. This adds initial work but reduces risk of “open” SNMP and simplifies audits.
Pilot: plan to validate the benefit
Don’t start by converting everything — begin with a pilot. This shows whether new collection brings tangible benefit for your services, not just theory.
Write the goal in one paragraph and align it with decision makers. Make it measurable: detect short peaks faster, count link capacity more accurately, reduce device load, speed up RCA.
Choose a small representative scope: 5–20 devices and 2–3 critical services or segments. Good candidates are edge routers, aggregation switches, data center switches and places with prior complaints about unexplained slowdowns.
Pilot workflow:
- Record the baseline: current SNMP setup (interval, OID list, who consumes data).
- Agree on the telemetry metric set: mandatory (interfaces, errors, CPU/memory) and “problem” metrics (queues, drops, microbursts).
- Enable parallel collection: keep SNMP as-is and turn on telemetry on the same devices.
- Decide what artifacts will inform the decision: a few charts and a short report with numbers.
- Collect data for 2–4 weeks, capturing high-load windows and maintenance windows.
For a fair pilot agree frequencies and accuracy in advance: which metrics need per-second resolution and which can be per-minute. If users complain about second-level outages, 60-second SNMP poll will often smooth them out while streaming will show exactly when drops rose on a specific interface.
If the pilot is part of infrastructure upgrade or an integration project, tie it to a real service: benefits show up in fewer incidents and faster diagnostics, not just prettier charts.
How to measure benefit: success criteria
To avoid subjective debate, compare the same things: identical devices, same interfaces and the same period (for example, 7 days including working hours and nights).
Metrics that give an honest answer
Fix 4–5 indicators and measure them in parallel for SNMP and subscriptions:
- Accuracy: differences in counters per day and per week (deltas of octets/packets/errors), plus the number of events visible only at high frequency (short peaks, micro-losses, error spikes).
- Latency: time from actual start of the problem to the first monitoring signal and to engineer confirmation (look at median and 95th percentile).
- Delivery reliability: proportion of missed points, session breaks, average recovery time for subscriptions, losses during brief outages.
- Load: device CPU and memory, monitoring traffic volume, collector load (CPU, RAM, queue, write rate).
- Total cost of ownership: storage growth per day, resources for collector/DB and operational effort for setup and maintenance.
A useful trick is to calculate the “cost of frequency.” Moving from 60s to 1s increases points 60x. This immediately shows storage and collector requirements, but often pays off by reducing detection time.
When the pilot is successful
Consider the pilot successful if real incidents have fewer blind spots, root causes are confirmed faster, and extra load on devices and storage stays within agreed corridors.
Common mistakes when switching
Problems are usually about expectations and scale, not protocols. Streaming reveals details quickly but punishes haste.
First trap — start with maximum frequency. Result: event avalanche, queue growth, database bloat, slow dashboards and eroded trust in monitoring. In a pilot it’s better to deliberately limit frequency and subscriptions, then raise them gradually.
Second mistake — collect “everything.” Subscribing to dozens of YANG trees “just in case” complicates diagnostics and raises storage costs. Start from services: what you protect (links, VPNs, voice, critical apps) and which metrics impact them.
Third trap — expect streaming to fix poor normalization and noisy alerts by itself. If you have noisy thresholds, wrong units or missing event correlation, streaming will bring the same chaos more often. Fix naming, thresholds and deduplication first.
Also mind hardware and vendor limits: subscription limits, buffer sizes, device CPU. A few subscriptions may work fine, but as sensors grow the device can start dropping messages.
To avoid getting stuck, set simple pilot rules in advance:
- limit metrics to 10–20 key signals and 1–2 failure scenarios
- set a cap for data volume (per second and per day) and device load
- agree stop criteria (e.g., CPU above X% or message loss above Y%)
- prepare a rollback plan to SNMP polling without downtime
- appoint an owner for data schema and alerting
A good pilot can be stopped at any time and still answer: where real benefit exists and where complexity is unnecessary.
Checklist before deciding to adopt
Moving from polling to subscriptions usually fails on details: what exactly to collect, at what frequency, who can access it and whether your monitoring platform can handle it.
First, agree the goal: what should improve in daily operations — faster root cause finding, seeing short peaks, reducing device load, simplifying investigations. Without this, a pilot easily becomes a dump of “everything.”
Run a short verification:
- Telemetry support on target devices and OS versions: which platforms actually support gNMI/gRPC, what sensors are available, and limits on frequency and subscriptions.
- Metrics and frequencies: what’s critical (interfaces, queues, CPU, memory, BGP/OSPF, errors) and estimated daily data volume.
- Security: encryption, certificates, accounts, access separation, segmentation, storage and access rules.
- Collector monitoring: queues, delivery delays, message loss, disk and CPU load. If the collector stalls, dashboards will look good but conclusions will be wrong.
- Cross-check with existing data: do key charts match, are there fewer blind spots, did alert quality improve (fewer false alerts, faster response), is investigation clearer?
If at least two answers are unclear, start with a small pilot on 2–3 device types and one or two critical metrics.
Practical example: short traffic spikes that SNMP misses
Imagine an office or small data center: users complain of a 10–20 second daily freeze of telephony and file access, then everything returns to normal. Application logs show latency spikes, but network monitoring is green.
With 60s SNMP polling you see an average over the interval. If the uplink had a short 8–12 second near-100% spike with growing queues, it will dissolve into the minute average. If charts are built from byte-counter derivatives, SNMP honestly shows bytes transferred in a minute but not that buffers filled and packets were dropped inside that minute.
Streaming telemetry helps catch such micro-overloads. In pilots people typically use sample (e.g., 1s) for key interfaces and on-change for events that matter by themselves (queue growth, error spikes, state changes).
To test the effect you need only one problematic segment and a short pilot. Minimum set:
- 2–3 uplinks or inter-switch links with repeated complaints
- 1s sampling for interface utilization and drops
- queue/buffer and discard metrics (if the device exposes them)
- compare detection and load: “did we catch the spike” and “what happened to CPU/traffic/storage”
Often the outcome is hybrid: keep SNMP for availability, inventory and long-term trends, and enable streaming selectively where seconds and detail matter (uplinks, core, data center edges, critical services).
Next steps: migrate safely with clear benefits
The safest path is not to “turn off SNMP” but to build a hybrid. Keep SNMP for basic checks and simple counters, and enable streaming where frequency, accuracy and fast alerts matter: backbone interfaces, critical services and data center bottlenecks. This lets you compare approaches on the same devices and retain familiar reports.
Start with a small pilot and expand using a template: consistent subscription sets, volume limits, clear storage rules and a pre-defined rollback.
If the pilot coincides with infrastructure modernization, involve both hardware and integration teams. For example, GSE.kz as a vendor and integrator can help design infrastructure for telemetry collection and storage (servers, platforms) and provide 24/7 operational support.
A practical next step is to agree metric lists and frequencies, choose a network segment and run a 2–4 week pilot with predefined success criteria.
FAQ
When is SNMP no longer enough and you should consider streaming telemetry?
If you need to catch events shorter than your polling interval (for example, 5–20 seconds), SNMP will almost certainly “smooth out” the picture. Streaming telemetry is useful when you need second-level detail for queues, drops, micro-losses and quick CPU spikes, and when accurate measurement timestamps matter.
Do I need to completely disable SNMP when moving to telemetry?
Start with a hybrid: keep SNMP as a baseline (availability, inventory, simple counters) and enable streaming on a few critical nodes. This lets you compare data on the same interfaces and preserves existing reports and alerts.
Why are timestamps in telemetry more important than they seem?
With SNMP you usually know the poll time, not the moment the device measured the value, so peaks between polls are lost. Streaming typically includes measurement timestamps and yields a smoother series, but you must verify clock synchronization on devices and the collector, otherwise analysis will be wrong.
What metric frequency should I choose for a pilot to avoid drowning in data?
A common starting point is 1–5 seconds for interface metrics and queues where there are complaints, and 5–15 seconds for CPU/memory diagnostics. Use on-change for statuses and sessions to avoid generating unnecessary traffic.
Can streaming telemetry be misleading because of delays and buffering?
Yes — if the collector or network cannot ingest the stream fast enough, the device may buffer and delivery will be delayed. In a pilot, measure the delay between measurement time and receipt time, and monitor session drops and missing points.
What increases device load the most with streaming telemetry?
Most often it’s caused by overly broad subscriptions and too-high frequency for everything. Load also grows when you subscribe to large data trees without filtering and don’t control the number of sensors and active sessions per device.
How to tell if the monitoring backend can’t handle the telemetry stream?
Look at three things: how many points per second you receive, how consistently they are written to storage, and whether the collector’s input queue grows. Practical signs of trouble are dashboards lagging or gaps appearing during peak times.
How to quickly and fairly compare SNMP and telemetry in a pilot?
Record the SNMP baseline and enable telemetry in parallel on 5–20 devices for 2–4 weeks. The easiest proof of success is real incidents: did detection latency drop, was root cause confirmation faster, and did device and storage load stay within agreed limits?
Is it normal that some equipment will stay on SNMP forever?
Yes. A hybrid is common because some devices may not support the necessary sensors or gNMI/gRPC versions. Use streaming selectively where seconds and detail matter, and keep SNMP for inventory and basic trends.
Who can help implement and operate telemetry if we lack expertise?
Vendors and integrators usually help design the collection and storage topology, estimate data volumes, choose servers and configure secure access, then provide operational support. For example, GSE.kz can handle both infrastructure for collectors/storage and 24/7 operational support so your pilot doesn’t stall for lack of resources or processes.