Calculating SIEM License Costs: EPS, GB per Day, and Retention
We show how to calculate SIEM license costs by EPS and GB per day, estimate storage and add growth buffer so you don’t hit limits in six months.
Why calculate EPS, GB per day and retention in advance
SIEM usually grows faster than expected. Today everything works because not all sources are connected, not all correlation rules are enabled, and some logs are not yet sent. In 3–6 months new systems appear, auditors ask for more data, the security team enables more detailed events — and suddenly you hit limits.
Therefore it’s better to start license calculation not from the price tag, but from understanding what constraints the licensing model includes and how they will change as infrastructure grows.
Most often you will face limits on:
- EPS (events per second), sometimes both average and peak
- GB per day (volume of logs received or indexed)
- retention capacity and time (online and archive)
- number of sources (hosts, agents, connectors)
- available features (correlation, UEBA, SOAR, tiered retention)
Underestimating these quickly leads to unpleasant consequences: the SIEM begins dropping events, delaying processing or disabling some sources. At that point you lose visibility and the chance to spot an incident in time. Often teams must urgently buy more capacity at a premium or pause rollout until the budget is approved.
Overestimating is painful too. You overpay for unused capacity and lock funds that could go to detection rules, integrations and training.
This calculation matters to several roles at once. InfoSec needs to avoid losing events and meet regulator requirements. IT needs to estimate network, storage and infrastructure load. Finance needs to budget growth in advance and avoid ad-hoc purchases. System owners must agree which logs are actually needed.
A simple rule of thumb: if you plan to add sources or expand auditing, calculate EPS, GB per day and retention with growth in mind, not just the current state.
Terms: EPS, GB per day and storage tiers in plain language
To compare offers and avoid hitting limits in a few months, first agree on terms. Different solutions may count the same things differently.
EPS: what it is and why the numbers “jump”
EPS (events per second) is the number of events per second the SIEM ingests and processes. An event is not always a single log line. Some solutions treat any received record as an event, others count a parsed record, and others only what passes filters and is indexed.
Details that strongly affect EPS:
- what is considered an event: raw log, normalized or “enriched” event
- how duplicates, retries and retransmissions are counted
- whether aggregation is used (several similar logs become one event)
- whether deep normalization and correlation are done at intake
GB per day: raw vs “finished” data
GB per day is the volume of data you generate and send to the SIEM each day. But there are two different volumes: raw logs (as sent by sources) and data after processing (normalization, fields, enrichment, indexing). The latter is almost always larger. If license or retention is billed by daily volume, clarify which volume is used.
Storage tiers: hot, warm, archive
Storage is usually divided by access speed and cost. The hot tier is for fast searches and investigations and is kept for a shorter time. The warm tier is cheaper but slower; retention there is usually longer. Archive is for compliance and rare queries: it’s the cheapest tier but less convenient to access.
Retention times are set by regulators and internal rules (for example, 30 days in hot and 1 year in archive).
Average and peaks: what to plan for
Average EPS and GB per day help budget, but limits are often consumed by peaks: mass updates, vulnerability scans, incidents, authentication bursts. If you ignore peaks, the SIEM will start dropping data or queuing it at the worst moment.
What input data to collect before calculating
So your calculation isn’t done in a vacuum, start with a list of what will actually send events and how that changes over time. Then translate those data into EPS, GB per day and retention requirements.
-
Make a complete list of log sources and their role. People often forget “small” sources that later consume limits: proxies, DNS, mail gateways, cloud logs, business app logs. The basic set typically includes AD/LDAP, VPN, EDR/AV, firewalls, Windows/Linux servers, network equipment, databases and key applications.
-
Collect actual log volumes by measurement, not guesswork. A practical minimum is a 7–14 day sample, with weekdays and weekends separated. If possible, capture two numbers per source: average EPS and GB per day (from disk usage or current logging system). That shows, for example, that VPN is quiet at night while EDR provides a steady stream.
-
Note seasonality and peaks separately. They are often caused by normal operations: patch windows, scheduled audits, month-end closing, migrations, user training. Record “peak days” as a separate category so they aren’t smeared into the average.
-
Fix plans for the next 6–12 months: new branches, additional systems, cloud migration, EDR rollout, perimeter expansion. These change load more than you expect. For example, adding a segment of 500 workstations can noticeably increase AD and EDR events.
How to estimate EPS: basic calculation and peak accounting
For licensing and infrastructure, two numbers matter: average EPS (day-to-day) and peak EPS (how the system handles spikes).
Start with a basic per-source calculation. If a source doesn’t provide EPS directly, take the number of events over a period and divide by seconds. For example, 8,640,000 events per day = 8,640,000 / 86,400 = 100 EPS.
Then record peaks: mass updates, morning logins, vulnerability scans, incidents, network failures. Consider not only peak height but duration: a short spike may be absorbed by buffers, while a long peak becomes data loss.
A practical approach:
- make a table of sources with average and peak EPS
- sum average values to get the baseline
- sum peaks to get a worst-case for simultaneous spikes
- add a buffer: +20–30% for growth and an extra buffer for peaks (often 1.5–2× baseline, or use your worst case)
- clarify how the vendor licenses intake: by average, by peak, in tiers, or with a hard per-second cap
Small example: average 60 EPS (AD, EDR, firewall, servers), but once a day a 10-minute scan produces 250 EPS. The intake capacity must handle 250 EPS plus growth, otherwise you’ll hit license limits or start losing events.
Also check infrastructure bottlenecks: queues and buffers on collectors/agents/brokers, parsing and normalization speed, source connection limits, disk write speed and queue overflow, and event dropping under backpressure.
If a peak lasts longer than your buffers, it’s not noise but a new normal. That must be reflected in licensing and intake capacity.
How to estimate GB per day: what to count and how to avoid mistakes
GB per day answers how much data you’ll load into the SIEM each day. This affects price and how quickly you hit limits and need to cut logs.
Rely on real measurements for at least 7–14 days. If the SIEM doesn’t exist yet, capture data from current collectors, syslog servers, EDR consoles and cloud logs.
For each key source note:
- GB/day (raw export or current dump)
- event count and average event size (if available)
- share of noisy log types (DNS, proxy, NetFlow, firewall allow)
- enabled detail levels (debug, audit, verbose)
- periods with sudden volume increases (updates, scans, reports)
Remember input volume and internal SIEM volume often differ. After parsing, normalization and enrichment an event can grow; sometimes noise is dropped. It makes sense to allow a coefficient to check in a pilot, e.g. +20–50% if you plan active enrichment and many fields.
Separate noise from signal. Example: a proxy logs every request, but investigations often need only blocks, rare domains and volume anomalies. A good principle: keep full detail for a short time, then move to aggregated records.
You can filter or aggregate without losing meaning if you first answer:
- which events participate in correlations
- what fields are needed for investigations (minimum set)
- which logs are only for reporting
- which sources can be sampled or recorded selectively
This yields an honest GB/day rather than a number that looks good at purchase and breaks in six months.
Retention planning: periods, tiers and a simple capacity calculation
Retention is where budgets often diverge from reality. You need to understand upfront how many days of data must be in fast access and what can be stored cheaper.
Split requirements into operational needs (investigations, searches, SOC reports) and audit/compliance (often longer retention but not always fast access).
Then allocate logs to tiers:
- hot: fast search and correlation, usually the most expensive
- warm: searchable but slower; typically holds the main history
- archive: for audits and rare queries; access is limited or via export
A basic capacity estimate is simple: daily volume multiplied by retention days and add a buffer.
Емкость = GB_сутки x Дни_хранения x Кзапаса
Factor in a buffer for growth and unforeseen sources. Practically, teams often use 1.2–1.5 if forecasts are uncertain.
Real disk needs depend on more than GB/day. People often forget three multipliers:
- compression (varies greatly by log type)
- indexing (fast search requires indices which add space, especially in hot tier)
- replication (if you store copies for HA, multiply capacity by number of copies)
Example: 120 GB/day. Requirements: hot 14 days, warm 90 days, archive 365 days. Per tier: 120 × 14 = 1680 GB (hot), 120 × 90 = 10800 GB (warm), 120 × 365 = 43800 GB (archive). Total 56300 GB, then multiply by buffer (e.g. 1.3) and separately account for indexing and replication where applicable.
Step-by-step methodology (vendor-agnostic)
The logic is straightforward: first calculate actual load (EPS and GB/day), then add buffers, and only afterward map those numbers to a vendor licensing model.
-
Compile the list of log sources and forecast changes. Note what will appear in the next 3–6 months: new branches, sensors, enabled audits on critical systems.
-
Measure EPS and GB/day from real data. If the SIEM is not in place, capture metrics from collectors/agents or current logging systems. Mark peaks separately (normal day, patch window, incident).
-
Add buffer coefficients. Typical guidelines:
- growth: +20–50% (closer to 50% if the project expands)
- peaks: 2–5× for specific sources (often VPN, proxy, EDR)
- processing overhead: +10–30% for parsing, normalization and service events
-
Convert load into license limits and check constraints: EPS, daily volume, number of sources, available features and any limits on correlation. Compare “average day” and “peak day” separately.
-
Calculate retention and infrastructure for ingestion, search and archive. Split storage by tiers and verify the system can handle ingestion peaks and analysts’ queries simultaneously.
Mini-example to avoid mistakes
If you currently have 1,200 EPS average and peaks at 3,000 EPS, and you plan to add EDR and network devices, a license based only on average will almost certainly hit a ceiling. It’s safer to allow for peak load plus growth and separate retention for operational use and compliance.
Typical mistakes that make limits run out unexpectedly
The most common reason is using a tidy average. EPS fluctuates, and if you buy a license with no headroom, in months you’ll face drops, delayed correlation or forced source disablement.
Another trap is confusing incoming volume with stored volume. GB/day is input; retention depends on normalization, enrichment, indexing, compression, duplicates and service fields. Without multipliers you can be off by 1.5–3×.
A frequent scenario: the project accumulates sources but the calculation is never updated. Today it’s domain and network devices; tomorrow EDR on 500 endpoints, cloud logs, WAF, a new business service and DB audit are added. On paper this looks like small additions but EPS and volume can exceed the original core by a lot.
Noise often eats limits. If everything is collected with no policy (debug logs, frequent allow events, verbose proxy logs), volume grows while value doesn’t. Rules are needed: what to filter at intake, what to aggregate, what not to store at all.
Finally, storing everything at a single retention tier is costly. Either you pay too much to keep everything “hot” or you must cut retention suddenly and lose investigation data.
For self-check:
- peaks are accounted for (e.g. 95th percentile or 2× average) and “storm” tests are done
- you have coefficients: input volume vs actual storage (including indexing and service data)
- a list of sources for +6 months exists (EDR, cloud, new apps) with growth estimates
- filters and basic log hygiene are defined and retention is tied to data value
- hot storage and archive are separated so you don’t pay for speed where it’s unnecessary
Practice example: you enabled detailed audit on domain controllers during a pilot. The pilot ended but the settings stayed. EPS and daily volume increased; the limit ran out not because the SIEM was bad, but because no one enforced what to collect, retain and when to review the model.
Example scenario: a 6-month calculation with growth
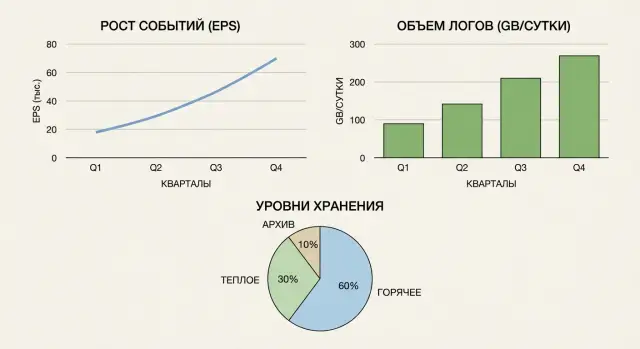
Imagine a company with 800–1,500 users and several branches. Over six months staff and load grow by 20%. New sources are added: EDR on endpoints, proxy, mail gateway and VPN.
Initially AD, Windows server events, network devices and a few business apps are connected. Measured over 7–14 days we see on average 900 EPS and 25 GB/day. Peaks reach 2,500 EPS during work hours (morning logins and updates).
After six months new sources arrive. EDR typically increases both EPS and volume. Proxy generates a lot of chatter; VPN causes spikes during incidents and mass connections. Without filtering, this can look like 1,600 EPS and 50 GB/day average.
Apply normalization and hygiene: remove obvious noise, limit overly detailed events where not needed, enable deduplication. If the license counts raw input, this may not reduce licensing costs, but it often lowers storage and search load. For example, useful hot-stream data may shrink by 20% to 40 GB/day, while licensing still plans on 50 GB/day input.
With 20% growth by period end, planned figures become about 60 GB/day and 1,900 EPS (with same peaks).
For retention: hot 30 days, archive 180–365 days. At 60 GB/day hot storage is 60 × 30 = 1,800 GB (1.8 TB) plus indexing/metadata overhead, often 30–50% (total ~2.4–2.7 TB). Archive for 365 days: 60 × 365 = 21.9 TB. If archive compresses 2×, that’s ~11 TB, but it’s safer to plan with margin.
To avoid emergency license buys, commonly plan:
- EPS buffer for peaks: at least 2–3× average
- GB/day buffer: +25–40% for new sources and initial noise
- a dedicated buffer for incidents (DDoS, mass EDR alerts)
- retention buffer: +30% for indices, retention and growth
- a quarterly expansion plan even if purchases are annual
Short checklist before purchase and rollout
Before buying licenses and enabling collection, confirm the basic numbers and agreements are documented.
- full list of sources (AD, VPN, EDR, firewalls, servers, business apps) with an owner for each
- average and peak EPS per key source, measurement periods and conditions (normal day, patch window, incident)
- GB/day calculated not only as raw input but also after processing (normalization, enrichment, duplicates, service fields); if SIEM keeps both raw and processed data, treat them separately
Agree on retention tiers and periods beforehand. Otherwise one team expects a year of hot search while the budget was sized for two weeks.
- retention periods and tier split (hot for investigations, warm for routine checks, archive for compliance) are approved
- buffer for growth and new sources is defined with clear assumptions (for example, +20% events per quarter and N new systems)
Finally ensure licensing, storage and hardware don’t conflict:
- licensing model and real numbers are compatible (limits on EPS, daily volume, stored data)
- performance can handle peaks: ingestion, parsing, correlation and reporting
Mini test: if tomorrow you add one large source (EDR across all endpoints), you should already know how much EPS, GB/day and storage capacity will grow and which limit will become critical first.
Next steps: alignment, pilot and scaling plan
Once you have EPS, GB/day and retention figures, turn them into clear requirements for procurement and IT. Document not only “what’s needed now” but “what will be needed in 6–12 months.”
A short 1–2 page document is usually enough: which sources to connect, expected average load and peaks, retention by tier (hot and archive), and growth buffer. Also define what constitutes exceeding limits: event loss, search delays, storage overflow or sudden cost spikes.
To avoid hitting a ceiling in six months, agree in advance on scaling rules: when to increase license limits for EPS/volume and when to add storage and compute resources.
A pilot is useful when sources are many, data is noisy or peaks are uncertain. Simple workflow: connect critical systems (AD, VPN, EDR, key servers), run for 2–4 weeks, re-measure and update calculations before final purchase.
If you need support, GSE.kz can assist with assessment and calculation, SIEM implementation as a system integrator, and selecting servers and storage. For scalable capacity teams often choose expandable compute nodes, for example based on rack servers S200 Series, and 24/7 support so scaling happens without downtime.
FAQ
Why calculate EPS, GB per day and retention for SIEM in advance?
Because load almost always grows: new sources are added, more detailed events are enabled, correlation rules expand and audit requirements increase. If you calculate only from the current picture, in 3–6 months you can easily hit limits and start losing events or experience processing delays.
What limits are most often found in SIEM licenses?
Common limits are EPS (often separate average and peak), daily data volume (ingested or indexed), retention time and capacity (hot/warm/archive), number of sources, and available features. It’s important to know exactly what your plan limits so you don’t buy the wrong package even if prices look similar.
What is EPS and why do different SIEMs count it differently?
EPS is how many events per second the SIEM can accept and process, but different products define “event” differently. In some systems it’s a raw log line, in others a parsed/normalized event, and elsewhere only what gets indexed after filtering. That’s why numbers can differ when comparing solutions.
How to account for peaks so you don't buy a license that’s 'just enough'?
First record the average EPS for normal days, then separately measure peaks during updates, morning logins, scans and incidents. For procurement it’s safer to plan for the peak plus growth margin; otherwise you risk drops or queues during high-load periods.
Is GB per day the incoming logs or what is stored inside the SIEM?
GB/day usually means the amount of data you send to the SIEM daily, but you must clarify the measurement point. After parsing, normalization and enrichment the data often grows, so confirm whether the vendor charges for the raw input stream or for processed/indexed volume.
What data should be collected before calculating the load?
Base your calculation on measurements, not guesses: collect at least 7–14 days, separate weekdays and weekends, and mark peak days. If EPS is not directly visible, count events for the period and divide by seconds to get EPS.
How to choose retention periods and split between hot/warm/archive?
Decide first how long you need fast access for investigations and searches, and separately what you need for compliance. Then split data across storage tiers, because keeping a full year in the hot tier is usually too expensive.
How to quickly estimate how much disk is needed for retention?
Simple formula: daily volume × retention days × buffer factor. In practice you must also consider compression, indexing overhead and replication for availability, so real disk needs are often 1.5–3× the raw math.
What errors most often lead to suddenly exceeding limits?
Typical mistakes are using a convenient average and ignoring peaks, confusing incoming volume with stored volume, not updating calculations when adding sources, and collecting everything without hygiene. Noise from verbose logs quickly eats limits while adding little value.
How to safely move from assessment to implementation and scaling of SIEM?
Start with a short pilot on critical sources for 2–4 weeks to verify real peaks and post-processing growth. Then document scaling rules: when to increase license limits and when to add storage/compute. If needed, GSE.kz can perform assessment and sizing, implement SIEM as an integrator and select servers and storage (for example based on rack servers S200 Series) to scale without downtime.