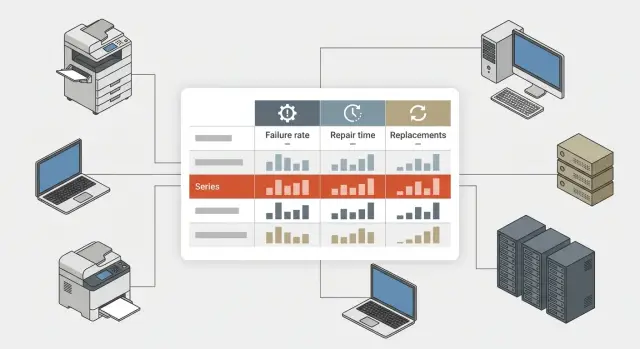
Service analytics for equipment batches in procurement
Service analytics by equipment batches helps track failures, repair and replacement timelines so you can spot a problematic batch early and adjust procurement.
Why problems with a batch of equipment are often noticed too late
When 2–3 failures appear in an equipment fleet, they are often seen as normal background noise. One PC won't boot, another has a failed drive, a third freezes under load. If devices are in different branches and reports arrive at different times, it all looks like a set of random incidents.
That's the risk. A problematic batch rarely fails all at once or in the same way on every device. Some devices break in the first month, others later after similar loads or the same usage pattern. If you look only at the brand or model overall, the picture blurs. The failure rate may look acceptable, even though it's rising within a specific shipment.
Because of that, procurement decisions can rely on statistics that are too general. A model looks reliable, there are few service cases, but one series drags down repair times, budget, and staff workload. Downtime increases, field visits grow, spare parts are consumed faster, and some devices have to be replaced earlier than expected.
This is especially costly where equipment is needed every day: in schools, hospitals, government agencies, banks, and high-load offices. If several identical workstations from one batch fail in quick succession, losses go beyond repair costs. Work slows down, urgent reassignments are needed, and unplanned purchases occur.
Usually warning signs become visible only after repeated reports for the same components, rising average repair time, frequent warranty replacements in one shipment, or complaints coming from the unit that received a particular series.
That's why batch-level analysis is more useful than a general model-level view. This perspective shows what happened to devices produced or delivered in the same period, with similar configurations and identical components. It helps spot a problematic series earlier and avoid repeating the mistake in the next purchase.
For the buyer this is a simple but important shift. The question becomes not whether a model is good or bad, but which specific shipment failed, where it happened, when issues began, and how severe they are. That's where the accurate response starts.
What data is needed for each batch
To make analysis useful for procurement, it's not enough to record that a failure occurred. You need the device's entire path: from delivery to repair, replacement, or write-off. Otherwise you'll only see total failure counts without understanding whether the issue lies in the batch, in operating conditions, or in installation errors.
Each piece of equipment should have a clear record. For PCs, all-in-ones, and servers it's usually enough to record the serial number, model, configuration, batch number, delivery date, acceptance date, warranty start, commissioning date, and exact installation location.
Two things are especially important: the actual start date of operation and the place of use. If a batch arrived in January but some devices were only put into use in March, comparing failures by delivery date is wrong. The same applies to locations. Equipment in a head office, a school, a clinic, or a server room works in different environments, and that greatly affects results.
What to record for each service case
It's better to log each failure as a separate service case rather than a brief note like "doesn't work." Record the date of the report, external symptom, confirmed cause, replaced parts, repair location, and final outcome.
The outcome is especially important. A device may have been fixed, replaced under warranty, sent back for another repair, or written off. Without that status, procurement won't see the real picture. Formally there may be few failures, but some devices will repeatedly return to service after repair.
A good practice is to link service records not only to the specific device but also to the delivery batch. This is important in large purchases when the same model arrives in multiple batches. Then it's clear that the problem affects one series, not the whole line.
A simple example: one batch of workstations started failing a month after launch, while another batch of the same model showed nothing similar after a year. This suggests the cause may not be the model at all, but the specific shipment, components, or commissioning conditions. Such data lets you change requirements for the next purchase in time.
Which metrics really help
The most common mistake is looking only at the total number of failures. That number explains almost nothing. If one batch is twice the size of another, it will almost always have more reports.
It's much more useful to calculate the share of failures over defined periods: the first 30, 90, and 180 days after commissioning. These timeframes show different problem types. Failures within the first 30 days often point to a manufacturing defect, assembly error, or poor batch control. Growth at 90 and 180 days is more often linked to a problematic component, poor configuration, or operating conditions.
Keep several metrics in focus:
- share of failures for each batch within 30, 90, and 180 days;
- frequency of repeat failures after repair;
- concentration of failures in a single branch, department, or site;
- breakdown of failures by component: power supply, drive, memory, screen, motherboard.
Repeat failures are particularly telling. If a device returns from repair and fails again shortly after, that's not an ordinary service case. Often this signals incorrect diagnostics, poor-quality replacement parts, or a systemic problem in the series.
It's also important to look at where failures occur. If 12 out of 100 devices fail, that's not enough to draw conclusions by itself. You need to know where those 12 failures happened. If almost all incidents are concentrated in one unit, the cause may be power quality, dust, overheating, or misuse rather than the batch. If failures are evenly spread across sites, suspicion of a bad series grows stronger.
A component-level breakdown helps make decisions faster. If most service cases in a batch of PCs, all-in-ones, or servers point to the same component, it's unlikely to be random. For procurement, this is a reason to request a configuration change, reconsider the supplier of that component, or reduce the next order volume for that specific series.
A good metric does more than count failures. It helps determine whether you're dealing with an isolated incident or a recurring batch defect.
What repair and replacement times reveal
Failure frequency is only part of the picture. Things become much clearer when you see how long devices are out of service and how quickly they are returned to working order. For procurement this can be more important than the number of reports.
A basic metric here is the average time from case registration to operational recovery. This includes diagnostics, approvals, parts delivery, field visits, and re-commissioning. If two batches have the same failure rate but one is restored in 2 days and the other in 9, their business risk differs significantly.
It's useful to look at several simple metrics, not just one average: average recovery time, median repair time, share of cases that exceeded the normal period, and the actual downtime without a replacement.
Downtime without a replacement is especially important. If a workstation, checkout, classroom PC, or server is down for several days without a spare, losses can exceed the repair cost. For schools, clinics, government bodies, and large companies this quickly becomes an operational risk.
The share of repairs exceeding the normal period helps reveal hidden batch problems. The average value may look acceptable, but if a quarter of devices in one batch take too long to repair, that's a serious warning. Usually that's caused by a weak component design, lack of spare parts, or a recurring defect.
These data also help answer the practical question: continue repairing or replace? Replacement is often more cost-effective if a device has failed twice in a short time, repair costs rise, downtime strongly affects a unit's work, or spare parts delivery is unreliable.
Imagine a batch of all-in-ones across branches. They don't fail often, but every second case drags on for over a week waiting for components. Formally there are few failures, but in reality workstations sit idle, staff lose time, and the IT team repeatedly addresses the same issue. In that case it's sensible to adjust the next purchase: reduce buy volume for that series, tighten service requirements, or allocate a spare pool in advance.
If a supplier has local production, service network, and lifecycle control, recovery times are usually more predictable. For procurement this matters at least as much as the initial price. In Kazakhstan this factor often plays a notable role, especially in large projects.
How to find a problematic series step by step
A problematic series seldom shows itself with a single incident. It reveals a repeating pattern: reports come from one batch, occur at similar times after commissioning, and the batch's failure and repair metrics are noticeably worse than other shipments of the same model.
To spot this, analyze each delivery separately: by batch number, delivery date, model, and place of use.
A practical workflow looks like this:
- Group all service cases by batch and delivery period. Note the batch size, commissioning date, and types of failures.
- Compare failure rates between batches of the same model. Count not only case numbers but the share of failed devices out of the batch total.
- Check time dynamics. If one series accumulates reports faster in the first 3–6 months, that's a strong signal.
- Look at recovery times. Sometimes the issue is not just frequency, but how long and how complex repairs are for a specific series.
- Separate warranty replacements. If there are many replacements, this becomes an argument for procurement and service action, not just an unpleasant statistic.
Distinguish isolated failures from systemic problems. If 2 units out of 500 failed with different symptoms, that's not enough evidence. But if 14 identical failures occur in a batch of 120 PCs or all-in-ones while a neighboring batch of the same model shows 2–3 such cases, that's not noise.
Watch indirect signs too. Sometimes a series' failure percentage isn't the highest, but repeat repairs increase sharply. For procurement that's as important as the first failure.
The final conclusion should be short and clear: which batch stands out, how it is worse than the others, and what to do next. For example: temporarily stop expanding purchases of this series, request a root-cause analysis from the service team, and revise requirements for the next delivery.
How this looks in practice
Imagine a routine procurement: an organization receives two batches of touchscreen all-in-ones for staff workstations. Acceptance showed no issues, and devices were quickly commissioned.
There were no concerns in the first weeks. Most equipment worked steadily and overall statistics looked normal. But a batch-level breakdown revealed differences that a consolidated view would have missed.
What the data shows
Looking at each delivery separately, the picture becomes clear:
- the first batch had only 2 touchscreen reports in the first 3 months;
- the second batch had 14 such reports in the same period;
- most cases in the first batch were resolved with repairs;
- the second batch more often required full device or module replacements.
On paper both deliveries looked the same. But one series ran stably while the other produced early touchscreen failures.
Procurement then looks beyond case counts at adjacent metrics. The problem batch had not only a higher report rate but also longer average repair times. If the stable batch closed cases in 4–5 days, the problematic one took 10–12 days because usual repairs often didn't fix the issue.
Another important signal is the share of warranty replacements. When repairs fail to fix problems on the first try, service moves to replacements. This affects not only IT but procurement: stock decreases, users wait longer, and total cost of ownership rises.
After such analysis, the next order isn't repeated automatically. The buyer might reduce the volume of the risky series, request a separate check of the touchscreen module before shipment, tighten warranty replacement terms, and split the next order into smaller lots.
This approach helps catch problems early — not when equipment is already failing en masse, but when the first deviations start to appear.
Where service analytics often goes wrong
The most common mistake is mixing devices from different batches, deliveries, or even years in one report. Then a weak series is lost among better ones and the overall picture looks smoother than reality. For procurement this is dangerous: decisions are made on averaged figures, not on a specific problematic series.
Another frequent error is looking only at the number of requests. Two identical numbers can mean different risks. In one case equipment was restored in a day; in another, a unit waited a week for replacement. So failure data should always be read alongside repair times and actual downtime.
Failing to separate an initial failure from a repeat visit for the same device is another issue. If a device was repaired and returns a week later, that's a different signal. Without separating these, a report may seem fine while repairs actually didn't solve the problem.
What distorts the real picture
Averages can be misleading. If you look only at the overall average repair time, you may miss that one site has quick turnarounds while another waits weeks for diagnostics, parts, or approvals. Breaking down by branch, region, and operating conditions often yields more value than a company-wide total.
It's also risky to draw conclusions after a single high-profile failure. A server or workstation outage in an important department grabs attention, but one incident doesn't prove the entire series is bad. You need context: how many devices are in the batch, how many failures have occurred, what's the share of repeat repairs, and how often did it lead to warranty replacement.
For a quick check ask five questions:
- are different batches and delivery dates mixed in the report;
- does it show not only case counts but also downtime;
- are repeat visits separated from initial failures;
- is there a breakdown by site and operating conditions;
- is the conclusion supported by a series of cases, not a single failure.
When the data structure is set up properly, the report stops being a formality and starts genuinely helping procurement.
A short checklist before the next purchase
Before a new delivery it's useful to look not only at price and specs but also at service data. These show which series may look fine on paper but cause extra downtime and costs in practice.
Before agreeing on volumes and composition, check a few things.
First, do you have a report by batches, not just a model-level summary. Second, does it show repair times and actual downtime without replacement. Third, are warranty replacements and repeat visits for the same unit recorded. Fourth, is it clear which series cost the most when logistics, field visits, spare pools, and lost working time are considered. Finally, is there a clear rule that triggers additional checks for a batch: too high a failure rate, long repairs, many repeat visits, or an unusually large share of warranty replacements.
If you can't answer at least two of these clearly, don't rush the procurement decision. First gather data in one report and compare batches, not just supplier prices.
For IT equipment procurement this is especially important where downtime affects services for people: in schools, clinics, banks, or government. One problematic series out of 100 devices may look acceptable in overall statistics, but it will create a queue of service requests and extra costs over the year.
If you work with a manufacturer or integrator that has its own service network, it's useful to request batch-level statistics on failures, repair times, and replacements in advance. This short check before ordering often delivers more value than another round of price negotiations.
What to do next
The main thing is to turn these observations into a steady way of working. If service sees one set of data and procurement another, decisions will again be based on impressions. So the first step is to agree on a unified recording format for both teams: the same batch names, commissioning dates, failure types, repair times, and replacement cases.
Then analytics stops being a checkbox and starts affecting supplier choice, order volume, and the composition of the next delivery. The fewer manual interpretations, the easier it is to spot a recurring problem in one series.
What to implement right away
- Agree on a single recording template for service, warehouse, and procurement.
- Mark the first 60–90 days after delivery as a period of heightened monitoring.
- In supplier meetings discuss not only price but also failure frequency, average repair time, and share of warranty replacements.
- For large projects check in advance who covers regional service and how quickly parts are available.
Pay special attention to new deliveries in the first months. Hidden batch problems often show up then: unstable power supplies, recurring drive failures, repeated screen or memory module issues. If a series stands out by service cases in a short time, stop expanding purchases until causes are investigated.
Also change the conversation with suppliers. A low price alone doesn't protect the budget if equipment frequently fails and spends long time in repair. It's much more useful to discuss facts: how many devices from similar shipments have already been repaired, average recovery time, what percentage was replaced under warranty, and whether there were issues with specific components.
For large procurements the partnership model matters. If a partner has local production, clear quality control, and a service network, risks are easier to assess in advance. In Kazakhstan this is especially important for public institutions, education, healthcare, and large companies. For example, GSE.kz as a local manufacturer and systems integrator combines equipment production, service support, and nationwide operations. That helps collect batch statistics faster and make more precise procurement decisions.
A good procurement starts not with the price list but with a clear understanding of how equipment behaves after delivery.