Servers for SIEM/ELK: calculating disks and resources for load
Servers for SIEM/ELK: how to calculate CPU, RAM and disks from EPS, retention, indices and redundancy so the pilot doesn't hit limits.
Where SIEM and ELK pilots usually run into trouble
Pilots often fail not because SIEM or ELK are "bad", but because the real load turns out to be different. A typical overload looks like this: events arrive but become searchable with delay, dashboards start to lag, and some logs are lost or only "catch up" at night.
The first signal is growing queues. First a buffer builds up at collection, then at processing (parsing, normalization), and finally the indexer is maxed out. You see a gap between "received" and "available for search." If that gap grows, the pilot is already running "in debt."
Most pilot failures stem from three underestimations: actual EPS, retention periods, and indexing cost.
People calculate EPS by the "average," forgetting peaks: Monday morning, mass updates, incidents, scans. Retention is estimated as "raw logs," while indices and system data significantly increase disk usage. Indexing is seen as "just writing," but it also includes field analysis, segment creation, merges and caches.
In a typical setup there are almost always four parts: collection (agents and collectors), processing (pipelines), search and analytics (indices and queries), storage (disks, replicas, backups). Any of them can be a bottleneck, but disks and CPU on indexing nodes usually give out first.
Before the pilot, agree on basics: how many nodes will receive and index data and how roles are split; which disks will handle continuous writes and background work without failures; the storage scheme needed (hot data for fast search and cheaper storage for history); how to handle disk or node failure (replication, RAID, backups).
A common scenario: a bank pilot starts with a "few sources," and within a week VPN, AD, EDR and network devices are added. EPS multiplies, and without headroom servers fall behind on indexing even if total disk capacity stays the same.
What input data you need for sizing
To choose infrastructure for SIEM/ELK and avoid hitting limits at pilot stage, collect a few numbers first. Without them, disk and resource sizing becomes guesswork.
Minimum required inputs:
- EPS (events per second) per source type: network devices, AD, EDR, application servers, databases.
- Average event size (in bytes) and share of "heavy" logs (for example, Windows Security, proxies, EDR).
- Retention: how many days to keep "hot" data for search and how much can be moved to "cold."
- Search and analytics load: number of users, dashboards, frequency of correlations and reports.
- Recovery window: how long the system can be unavailable without data loss, and whether you need a queuing receiver.
Do not take EPS from thin air. It's usually obtained one of three ways: check current SIEM statistics (if available), collect metrics from collectors and agents for 7–14 days, or do a short measurement on a test receiver (syslog/agent) during peak hours. Record both averages and peaks: pilots usually fail on peak values.
Event size varies. The same source can produce short system lines and rare but very large events (application errors with stack traces, EDR events, DNS/Proxy with many fields). Measure median and the 95th percentile of size.
For retention, define what counts as "hot" in advance. A common compromise is 7–14 days for quick investigation, with older data moved to cheaper storage. Also confirm regulatory and internal security requirements.
Example: a bank pilot starts with 50 sources and 3,000 EPS on average, but peaks reach 10,000 EPS during business hours. If SOC keeps dashboards open all day and correlations run every 5 minutes, CPU and fast disk requirements will be higher than for occasional manual searches.
Calculating data volume: from EPS to terabytes
To move from EPS to a meaningful storage volume, start with a basic estimate:
Daily volume = EPS x average event size (bytes) x 86,400.
For example, 2,000 EPS at an average size of 500 bytes yields: 2,000 x 500 x 86,400 = 86.4 GB per day (before overheads).
In practice, "raw" log bytes are only the beginning. Volume grows due to headroom for spikes, enrichment and the stack's own overhead. It's easier to use multipliers and not try to guess an exact number up front.
What usually increases volume:
- load spikes (incidents, scans, updates);
- event growth after parsing (added fields, tags, geo, user-agent);
- index overhead (structures for fast search);
- system data and component logs (Elasticsearch, Logstash/Beats, OS).
Compression helps but you can't rely on an "ideal 5x." It depends on sources: uniform events compress well, diverse ones (audit, EDR, proxy) usually less so. Use a conservative range.
Fault tolerance consumes space directly. Replica 1 roughly doubles disk space for data; replica 2 triples it. You also need headroom for shard relocation after a node failure: the cluster must survive a failure without disks immediately hitting 90–95% usage.
Other often-forgotten items on a pilot: snapshots (index backups), temporary segment files during merges, and persistent space for system indices and logs. Even if snapshots are stored externally, they still require planning windows and resources, so include them from the start.
Indexing and search: what loads servers the most
In SIEM/ELK the problem is often not "storage capacity" but processing speed: data must be accepted, parsed, indexed and made searchable almost immediately. So when choosing servers you care not only about terabytes but also CPU, RAM and the disk subsystem.
Indexing stresses CPU and RAM because Elasticsearch (and similar engines) constantly perform many small operations: parsing fields, building search structures, writing segments and later merging them. During spikes or active dashboards this shows up as high CPU, increased memory use for caches and system structures, and a queue of small writes to disk.
Hot data (recent hours or days) almost always needs speed. Here IOPS and latency matter more than raw capacity: a slow disk with large capacity quickly becomes a bottleneck when writes, merges and search queries run concurrently.
The hot-warm-cold scheme helps when long retention is required and old data is rarely queried. For pilots it often adds complexity: more node types, index-movement rules and additional places to misconfigure. It's useful to start simpler and add tiers once you understand the load profile.
Shards and replicas provide parallelism and fault tolerance, but too many small shards are dangerous. Excessive small shards increase memory and management overhead, and the cluster spends noticeable resources on its own maintenance.
Common performance pressures:
- heavy queries: many fields, aggregations, complex dashboards;
- frequent reindexing and on-the-fly parsing changes;
- too many shards per node;
- replication on slow disks;
- insufficient IOPS in the hot tier.
About memory: lots of RAM helps, but "just increasing the heap" isn't always the answer. Allocating too much to heap leaves little for filesystem cache, increasing disk reads. Often it's better to balance CPU and IOPS first, and grow RAM based on observed query behavior.
Choosing disks: speed, reliability, cost
The disk subsystem often becomes the limiter before CPU. Event ingestion is continuous while indexing and search create many small operations. Thus latency and IOPS matter as much as capacity.
A practical model is to split data into hot and cold tiers.
The hot tier accepts fresh logs, indexes actively and answers frequent queries. SSDs are mandatory here, NVMe is better: low latency reduces the risk of growing write queues and "choking" at peaks.
The cold tier stores older indices that are rarely written and seldom searched. HDDs are acceptable if slower archive searches are fine.
NVMe is often used as a hot buffer for 7–30 days: fresh data is quickly searchable, then indices move to cheaper storage by policy. This balances cost and speed, especially with unstable EPS.
Choose RAID according to goals: speed, capacity, or survivability on disk failure. Common options are: RAID 10 (predictable latency and writes, but half capacity used for mirroring), RAID 6 (more usable capacity and tolerates two disk failures, but writes and rebuilds are heavier), RAID 0 (fast but only for temporary buffers where data loss is acceptable).
To avoid a bottleneck, check the entire write path: issues often arise from the controller or HBA, network between nodes, many shards and small segments, and operating near full disk (background tasks then sharply reduce performance).
If predictability is needed, build in headroom and test the pilot under real scenarios: peak EPS, concurrent search, index rotation and disk failure recovery.
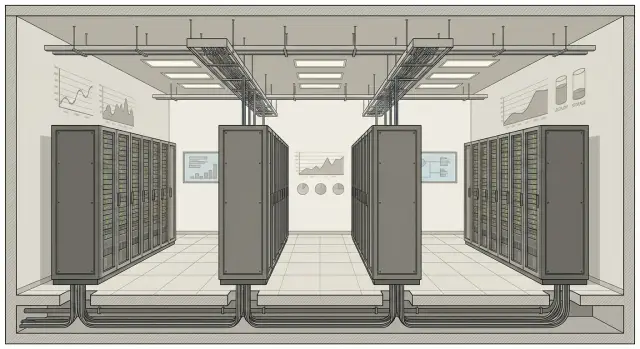
Server layout: nodes and roles without overcomplicating
Even when sizing for a pilot, start with a node layout. A common mistake is to put all roles on one or two servers, then suffer event loss and search delays.
Think of roles like this: some nodes receive and prepare logs, others store and index, a few manage cluster stability, and some serve user queries.
Minimum nodes that usually handle growth
For a small demo one node can be enough. For a pilot that must survive restarts, updates and growth, common layouts are:
- 3 nodes with combined roles (easy to start, harder to scale);
- 5 nodes: 3 master (cluster management) + 2 data (storage and indexing);
- 6–7 nodes: add 1–2 ingest nodes (receiving and parsing) and, if dashboards are active, 1 coordinator (search and aggregations).
Master nodes should not carry heavy data. Their role is cluster stability. Data nodes are typically the most loaded: disk, CPU and memory for indexing. Ingest nodes are useful when many sources require normalization and enrichment. Coordinators help when users run heavy searches so data nodes aren't overloaded by queries.
Network: what to check before procurement
Network issues often look like "not enough disks." Before launch, verify actual throughput between nodes and to collectors, latency and packet loss at peak hours, and how log ingestion traffic is separated from search traffic (at least logically). Plan extra ports and switching for future nodes and know where ingestion load balancers will sit if there are many sources.
A separate server for management and monitoring is useful when you don't want to take resources from indexing. Metrics, alerts, backups, upgrades and test tasks are better kept off the cluster.
Step-by-step sizing method
To avoid hitting a ceiling at pilot stage, size based on load and retention rules, not on "should be enough." This method can usually be completed in 1–2 meetings between security and IT.
-
Record average and peak EPS per source and in total.
-
Estimate event size. For rough sizing people often use 0.8–1.5 KB per event and add headroom for enrichment and index overhead.
-
Convert stream to storage: EPS x size x 86,400. Then add a safety multiplier (commonly 1.3–2.0) to account for peaks and growth.
-
Split storage by tiers and retention. Example: 7 days hot, 30 days warm, 180 days cold. If tiers are unnecessary initially, start with a single hot layer and limit pilot retention honestly.
-
Account for replicas and index overhead. In practice add another +30–50% to raw data.
-
Separate node roles. On a pilot a single "all-in-one" server that receives, parses, indexes and serves search is risky.
-
Perform a load test. Simulate peak EPS for at least 1–2 hours and check delivery latency, indexing rate and queue growth. If you see throttling, merge spikes, rejected threadpools or memory pressure, adjust: add hot nodes, change disks, revise retention and shard sizes.
Typical mistakes in calculations and piloting
The main reason pilots fail is not "too few terabytes" but ignoring overheads. People count only raw logs, then disks fill twice as fast. Replicas, system indices, temporary segments and varying compression all affect volume.
Second pain point is disk speed. Capacity may be enough, but writes can't keep up: queues grow, delays appear, drops occur and ingestion falters. A common cause is trying to keep hot indices on HDD or mixing heavy writes and queries on a slow array without IOPS headroom.
Third mistake is "put everything on one server to try it out." For SIEM/ELK servers this is usually a trap: the pilot quickly becomes production and migration is painful. Even if you start with a single node, have a plan to split roles and add nodes without downtime.
Another hidden killer is wrong shard sizing. Too many small indices cause extra memory and CPU load; too large shards slow search and recovery. Teams also forget growth: new sources, added fields and heavier event formats make yesterday's EPS estimate obsolete.
Pilots are often launched without a backup and recovery plan. After a template error or disk failure you may find recovery takes days.
Before launch, do a quick check: multiply calculated volume by replicas and system data and add headroom; verify disks can handle peak write throughput, not just capacity; set target shard sizes and rotation; add a 6–12 month growth forecast; describe backup and acceptable recovery time.
Quick checks before procurement and launch
Before buying hardware do a few quick checks. They often save weeks when you discover that "the average was fine" but peak ingestion lags by hours.
Confirm real event numbers: measure EPS and peaks for at least a week, preferably a month. Look at the shape of load: short spikes (after updates) and prolonged elevated background (business hours).
Check capacity with headroom. Elasticsearch grows not only from raw logs: replicas, snapshots, system data and indexing overhead consume space. If you plan 30 days retention, calculate what happens at 45 days to survive growth or delays in expansion.
Practical minimum:
- measure EPS and peaks, identify top sources and formats;
- verify disk sizing including replicas, snapshots and growth reserve;
- test disks for write performance and fast search on hot data in a lab;
- agree target metrics: ingestion latency, search time, RPO and RTO;
- plan expansion without downtime: adding nodes and disks in steps.
Example: a bank pilot works at 3–5k EPS, but once a week SOC runs heavy incident queries. During EDR peaks hot index writes start queuing. If you test "peak plus search" and add IOPS headroom, the pilot stays manageable.
Example calculation: a pilot for a bank or government body
Let's take a typical pilot: daytime 5,000 EPS, peaks to 12,000 EPS. Average event size 800 bytes (may grow after parsing). Retention: 30 days hot, 180 days cold, replica 1 (two copies), plus daily snapshots.
How much space is needed
Raw stream: 5,000 EPS x 800 bytes = 4 MB/s. Per day that's about 345 GB.
Add Elasticsearch overhead (indices, metadata, segments). For a pilot it's safe to use a multiplier of 1.3–1.5. We'll take 1.4.
- Hot 30 days: 345 GB/day x 30 = 10.4 TB raw. With 1.4 = 14.6 TB. Replica 1 doubles it: ~29 TB.
- Cold 180 days: 345 GB/day x 180 = 62 TB raw. With 1.4 = 87 TB. With replica: ~174 TB.
Add growth headroom (typically 20–30%) and system space. In this setup the pilot easily reaches ~250 TB of "dirty" capacity if cold is also stored in Elasticsearch with replication.
Snapshots should be counted separately. Daily copies require separate storage with room for several backup cycles and growth.
How to split roles and disks
To keep the pilot stable at peaks, separate ingestion and processing from data nodes. Practical minimum: separate ingest (receiving, parsing, enrichment) and data (storage and search). Use NVMe for the hot tier (low latency for writes and merges), larger drives for cold, and a separate contour for snapshots.
On the pilot check not "nice graphs" but overload signs: input queue (Logstash/ingest) and delivery latency; Elasticsearch bulk/write threadpool and number of rejected tasks; IOPS and disk latency (especially in hot); refresh/merge times and segment growth; real snapshot restore speed.
Next steps: moving from pilot to stable system
A pilot usually relies on assumptions: average EPS, "approximate" event size, expected retention. To avoid surprises, record assumptions in a simple table and agree them with source owners and security. Note not just numbers but rules: which systems are in scope, which are excluded, and what counts as a critical log.
Then run a short load exercise: 2–4 hours with realistic peaks. From that refine multipliers: event size after parsing, actual compression, share of noisy sources, indexing speed and queue delays.
After that the pilot becomes a 6–12 month growth plan. It should answer: what to do when EPS doubles or new sources appear (EDR, AD, network devices). Usually this is not "replace everything" but add nodes and expand storage.
Create a small checklist: which metrics are red-line (queues, indexing delay, disk fill, parsing errors); when and how nodes are added (threshold-based, calendar, before connecting new systems); where backups live and how long restore takes; who is on call 24/7 and what actions can be performed without approvals; how restores are validated (not just "backup exists" but "we restored and opened search").
If local procurement and support in Kazakhstan matter, plan who will supply hardware and support. In such cases it's convenient to work with local vendors and integrators like GSE.kz so configurations and expansion plans can be agreed and repeated without compatibility or service surprises.