Scaling an LLM Service: When One Server Is Enough
Scaling an LLM service: how to know when one node is enough, when you need a GPU pool, and how to choose orchestration and load balancing based on real metrics.
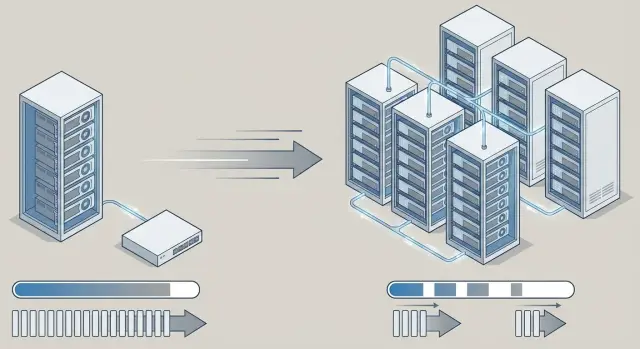
Why scale an LLM service at all
When traffic is low, a single GPU server usually does the job. But as users grow, the service can start to “lag”: response times increase, queues form, and at peak minutes you may see errors and timeouts. In the end users see not a smart model but a slow, unreliable button.
LLM load rarely grows smoothly. It usually spikes: mornings, before deadlines, after mailings, or when a new feature launches. If you plan “by eye,” it’s easy to fall into two traps: either buy too much hardware, or underestimate peaks and suffer outages at the worst moment. Both are costly, just in different ways.
It’s better to define targets in advance and check them regularly. Don’t look at the “average,” look at what users feel and what the business pays for:
- p95/p99 latency (especially for long responses)
- queue length and wait time before generation starts
- stability (timeouts, errors, restarts)
- cost per request and GPU utilization
Choose growth strategy to meet those goals. Vertical scaling strengthens one node (more GPUs, memory, faster disks). Horizontal scaling adds nodes and distributes requests. In practice teams often use a hybrid: first squeeze the most out of one server, then add a second or third node and tame the queues.
A simple example: a pilot chatbot for internal support can live on one server. But after several departments join, generation queues grow even with the same model. That’s the signal to move from “a single powerful node” to a system that handles peaks without panic.
Which metrics you need to stop guessing
To decide on inference growth, first agree what “normal” means for you. Without numbers it’s easy to overpay for hardware or, conversely, get complaints and queues.
Start with basic metrics that reflect real load and service quality. Collect them per endpoint and per model (if you run several):
- RPS and concurrent requests: how many arrive and how many are “in flight”
- p50 and p95 latency: typical user experience and the slow tail that usually hurts
- queue length and queue wait time: the main signal that you’re CPU/GPU-bound rather than network-bound
- errors and cancellations: 5xx errors, timeouts, and client cancellations from long waits
- GPU and CPU usage: utilization, memory, and stability (spikes matter more than average)
For LLMs track production metrics separately, otherwise p95 will stay a mystery. Count tokens per second during generation, average prompt and response length, and the share of long requests. Rare long prompts often create queues even when RPS looks modest.
Segment traffic by scenario: chat (long dialogues), summarization (long inputs), classification (short and fast), RAG (depends on search and DB). You’ll then see that “slowness” isn’t always due to the model: RAG can be blocked by data lookup.
Also mark peak windows. In organizations with reporting periods or mass mailings, load spikes at certain hours. In integration projects this is often visible during pilots: daytime RPS is stable, but p95 spikes during batch processing moments. Those peaks should be the basis for deciding to move from a single node to a GPU pool.
When one server is enough
One node often covers a pilot and even small production if load is predictable and there’s a single model. For scaling, first make sure you’re not “scaling just in case.”
Signs that one server is still sufficient:
- p95 consistently meets targets even in peak hours
- queue is almost always empty (or short and drains quickly)
- GPU doesn’t run at 100% for long stretches; VRAM has headroom
- RAM and disk have spare capacity; no active swapping
- generation speed (tokens/sec) doesn’t degrade over time
If metrics are marginal, strengthening the node often helps more than clustering: a GPU with larger VRAM, more RAM, fast NVMe for logs and caches, and a tuned inference profile (for example, shorter context or capped max tokens). This is usually cheaper and simpler than introducing orchestration.
You can tell you’re GPU-bound when utilization is high, VRAM nearly full, tokens/sec drops sharply as concurrency grows, and p95 drifts up. If swapping or I/O increases, the bottleneck may be memory or disk rather than GPU.
Risks of a single node are clear: it’s a single point of failure and rolling updates are harder (deploying a new model or driver often means downtime). For example, even a reliable GSE S200-class server requires stopping for maintenance unless you have a second node to failover to.
When to move to a GPU pool and multiple nodes
A powerful single server often covers a pilot: one model, predictable traffic, and small, tolerable queues at peak. But when load becomes “uneven” and user expectations tighten, you typically hit limits in concurrency and latency predictability.
The main signal is that the peak won’t fit on one node without queuing. If things are fast during quiet times but requests pile up during busy windows, first-token times grow, and p95 jumps, adding a second GPU in the same server might not help. Distributing across nodes usually smooths results: you add compute and reduce the risk that one process or model “fills” all resources.
Practical signs you need multiple nodes:
- queue grows consistently during peaks and p95 can’t be kept acceptable
- many concurrent requests cause jitter from small spikes
- you run several models or modes (chat and summarization) that interfere on one GPU
- you need high availability: maintenance and hardware failure mustn’t cause downtime
If you serve different user groups, separate their traffic: isolate critical requests (internal ops, support) from background work. In a cluster that’s easier with queues and dedicated nodes per model.
Multiple nodes are about reliability as much as speed. For orgs that can’t tolerate downtime (government, finance, large enterprises), being able to take a node offline for maintenance while keeping the service running is a strong business case.
How to split service by streams and priorities
When traffic grows, the main risk is not just a slow model but that everything starts to interfere: long requests clog queues, one client monopolizes a GPU, and urgent tasks wait behind background ones. Splitting streams often helps before you add hardware and simplifies future scaling.
Start by separating by task type. If you have short responses (chat, operator prompts) and heavy jobs (report summarization, large document analysis), don’t funnel them through the same lane. The simplest step is separate endpoints or queues: a “fast mode” with strict limits and a “precise mode” with longer context and wait time.
Sometimes it makes sense to run multiple model profiles: a smaller, faster model for routine questions and a larger, more accurate model for complex tasks. For example, “help craft a customer reply” goes to fast mode, while “prepare a detailed analysis with citations” goes to the precise model.
To keep multi-tenant scenarios from becoming chaotic, set priorities and limits ahead of time. Typical rules:
- categorize clients/services and give them separate queues
- enforce quotas per API key or project: max concurrent requests and token budget per minute
- limit heavy parameters: prompt length, max_tokens, number of parallel generations
- add timeouts and clear responses about limits so clients can retry later
- dedicate a pool or a fixed share of capacity to large customers
This approach is especially useful when one LLM service covers several departments (support, analytics, knowledge base) and everyone needs predictable responses.
Step-by-step scaling plan for real load
Growing is easier when you rely on numbers, not feelings.
-
Define SLOs. Write target p95 latency, required availability, and cost-per-request budget. Otherwise you may optimize a service that’s already good enough.
-
Collect a load profile. Peaks matter: morning spikes, batch tasks, seasonality. Note the share of short vs long requests—these load GPU and queues differently.
-
Choose a growth strategy. Vertical scaling (more GPU and memory in one node) is usually simpler at first. Horizontal scaling (multiple nodes) is needed when you hit a single-server limit or need resilience. Often you’ll use a hybrid: a strong primary node plus additional nodes.
-
Implement queues and limits before buying more GPUs. Cap parallelism, separate interactive and background requests, add timeouts and clear degradation rules (e.g., less context or shorter replies under overload).
-
Add a second node for fault tolerance, then expand the pool. Two nodes are a practical balance: deploy updates without downtime and survive a single-server failure.
Example: a pilot on one rack server (e.g., a GSE S200) handles weekdays, but p95 spikes during reporting periods. Start with priorities and a queue for batch jobs, then add a second node, and only expand the GPU pool when peaks consistently hit limits.
Orchestration: when you need it and what to choose in practice
Orchestration helps when you have more than one node and need rolling updates without downtime. While on a single server with rare releases it’s often simpler to manage manually, orchestration becomes valuable when you run a GPU pool, multiple inference instances, queues, and model versions.
What Kubernetes gives you in practice
Kubernetes solves common operational problems:
- placing services across nodes and accounting for resources (CPU, RAM, GPU)
- restarting on failure and self-healing after crashes
- horizontal autoscaling (HPA) by metrics
- rolling updates without downtime and quick rollbacks
- access policies and isolation between teams and services
When a simpler approach is enough
If you have 2–3 servers, rare releases, and predictable load, systemd, Docker Compose, or a basic VM orchestrator may suffice. This fits internal assistants updated monthly with no strict SLAs.
Whatever option you pick, keep basic hygiene: secret storage (keys, passwords), config management per environment (dev, test, prod), and image versioning. In integration projects typical for GSE.kz these details often matter more than the platform choice: they reduce downtime risk and update errors.
Load balancing and queue control
Load balancing exists to keep response times predictable even when load jumps. Separate two things: external distribution of requests across nodes and internal routing within the service.
External balancing decides which server, zone, or GPU pool gets a request. If a node is overloaded, the balancer should steer traffic away—but only after verifying the node is healthy and ready.
Internal routing often has larger impact. The same service may serve different models, contexts, and user classes. For example, short support queries can go to a dedicated pool, while long analytical prompts go to nodes with more memory and lower contention.
Sticky sessions are useful when you rely on caches (repeated prefixes, warmed model states, local tokenization cache). But stickiness complicates recovery after failures and can amplify imbalance if one client generates a lot of traffic.
To handle spikes, define simple rules in advance:
- rate limits per key or user so one source can’t block the queue
- request length and max token limits
- bounded queues with clear degradation (e.g., 429 or a shorter reply)
- timeouts for generation and queue wait
- circuit breaker to avoid pulling everything down when one node or model stalls
This is especially important if you deploy inference across multiple servers (for example, a rack of GSE S200-series GPU servers) and want steady operation without constant manual intervention.
Caches, memory and data: common slow points
A common reason a system seems GPU-starved is that the real bottleneck is memory or data. Before expanding the pool, measure how much time is spent outside generation: assembling context, reading dialog history, document search, or logging.
Caching helps when requests repeat and answers don’t depend on live data: reference questions, templated emails, and standard procedure responses. But if answers must reflect live prices, inventory, or ticket status, caches quickly become sources of errors.
KV-caches and prefix caches help when many requests share a common start: the same system instruction, identical prompt skeleton, or uniform chat template. The tradeoff is operational complexity: more memory use and higher risk of mistakes if sessions aren’t separated properly.
Storing conversational context can silently inflate latency. Agree in advance what to store, for how long, and where.
A useful minimum to avoid data-related bottlenecks:
- limit history length (e.g., last N messages or N tokens)
- set retention and deletion policies per chat type
- separate user context from system prompts (system prompts are easier to cache)
- watch memory: large prompts and long replies consume RAM and GPU memory fast
Logs and tracing are not for reports only; they show where time is lost: queueing, context fetch, tokenization, generation, or post-processing. Without this you may buy another server while the real bottleneck remains slow storage or overly verbose synchronous logs.
Example scenario: service growth from pilot to cluster
A pilot often starts simply: one server with one model and one GPU serving an internal staff chat. Requests are few, peaks rare, and latency is tolerable because the goal is to validate usefulness and answer quality.
After a few months the service is embedded in workflows and load jumps 10x. Peaks appear in the morning and after lunch, and p95 becomes a visible problem: queues grow, users retry requests, which in turn further loads the GPU. At that point growth starts with organizing traffic, not buying hardware.
First add a queue and simple priority rules: interactive chat above batch processing. Then add a second node to survive peaks and updates. Split models by role: a small model for quick answers and classification, and a large model only for complex queries.
To estimate GPUs, use measurable inputs:
- target p95, e.g., 3–5 seconds per response
- average token count: tokens in and out
- real model speed: tokens/sec per GPU
- peak load: requests/sec in the worst 15-minute window
A simple estimate: (peak requests) x (tokens per request) / (tokens/sec per GPU) and add safety margin, otherwise p95 will slip on any spike.
When nodes multiply, plan updates in advance. A practical approach is canary releases: route 5–10% of traffic to a new version, compare p95 and errors, then roll out fully. Rollback must be fast: keep old image tags and configs and be able to return traffic to stable nodes within minutes. At this stage rack servers like GSE S200 and 24/7 support are handy to avoid downtime in critical hours.
Common mistakes when scaling LLM inference
The first mistake is trusting average load. LLM services fail at peaks: Monday morning, mass mailings, month-end reports. If you design for the average you’ll get queues, timeouts, and complaints, even when overall charts look “fine.”
A second common mistake is adding nodes for raw capacity but not introducing rules. Without concurrency limits, explicit queues, and execution time control, requests will interfere and the GPU cluster will appear big but give unstable results.
People often underestimate the difference between light and heavy requests. One user asks for a short reply, another starts a long generation with a large context. If everything goes into one queue, heavy requests push out the rest and increase latency for everyone.
The costliest errors usually are:
- planning by average without accounting for peaks and tails
- adding nodes without queues, limits, and backpressure
- a single queue for mixed-complexity requests with no priorities
- no cost-per-1,000-requests calculation and no budget limits
- choosing orchestration “because everyone does,” without a clear operational need
Example: you ran a service on one server, added a second and load balancing. In peak both nodes go into long responses while short support queries wait 40 seconds. The fix is often not another GPU, but separate queues, quotas, and clear SLOs. If you build infrastructure locally on GSE.kz hardware, these rules are especially important: hardware supplies power, but predictability comes from queue discipline and limits.
Short checklist before moving to a cluster
Teams often move to a cluster too early: they add complexity and only later discover the real issue was timeouts or queues. This short list helps decide if you’re ready.
Before investing in multiple nodes and orchestration, check five things:
- clear SLOs (e.g., p95 latency and error rate) measured on real traffic, not synthetic
- limits and protections against spikes: timeouts, concurrency caps, retries only where safe, and clear overload behavior
- you know the bottleneck: GPU, CPU (tokenization), network, disk (logging) or memory (context and caches)
- a fault-tolerant minimum: a second node or reserve, update plan without downtime, and a recovery scenario for a hung GPU or process
- capacity and budget calculations for 3–6 months: expected requests/min, average context size, tokens per reply, GPU-hours
A practical test: if you already have to truncate prompts or disable features to keep p95, a cluster may be justified. If p95 swings because of spikes and lack of queue control, fix that on one server first.
When buying hardware, check that the vendor provides clear support and SLAs. For critical systems it helps if local manufacturing and service networks exist, as with GSE.kz: they reduce downtime risk during growth.
Next steps: move to a cluster without overspending
Collect at least a week of load profile. You need to see hourly peaks, share of long requests, queue wait times, and real user requirements. Then set SLOs with the business: for example, 95% of responses under N seconds and no more than M errors per 1,000 requests.
Often it’s better to start with a minimal, clear cluster rather than a big one. A two-node configuration frequently suffices: one node for main inference and a second to cover peaks and enable updates without downtime.
Practical order of actions:
- decide which models go to production and which stay in testing
- separate queues by request type: interactive, batch, internal
- choose simple routing: by priority and available GPU memory
- add limits on context length and timeouts so one request can’t block others
- run a load test with real prompts and set new thresholds
Decide in advance what to separate as you grow: models by node, queues by node, or both. For example, operator chat can run on fast interactive queues while nightly reports go to a separate queue so they don’t clog daytime service.
If you need help choosing servers, networking, redundancy and rack power, involve an integrator. Locally produced rack servers with onsite support—like GSE.kz S200 series—plus system integration and 24/7 support are especially useful during early incidents and tuning.
FAQ
How can I tell it's time to scale an LLM service?
Look at the user experience and peaks. If p95/p99 latency rises during active hours, queues form and timeouts increase, you’ve hit the node limit—even if the average load looks fine.
What metrics must I collect to avoid guessing?
Start with RPS and concurrent requests, p50/p95 latency, queue length and wait time, and the share of errors and cancellations. For LLMs also track tokens/sec, average prompt and response length, and the share of long requests—otherwise the cause of a bad p95 will remain unclear.
Why is relying on average response time dangerous?
Long-tail slow responses are what frustrate users most. The average can look fine while a small portion of very slow requests creates queues, retries, and cascading degradation.
When is one server really enough?
If p95 consistently meets the target even in peak windows, the queue is usually empty, and the GPU has headroom in memory and utilization, a single server is often enough. In that case it’s usually cheaper to tune inference and limits than to move to a cluster.
Which is better: vertical or horizontal scaling?
Vertical scaling strengthens a single node (more VRAM, RAM, faster disks). Horizontal scaling adds nodes and distributes requests to handle peaks and enable upgrades without downtime. In practice teams usually start with vertical and move to horizontal when they hit predictability or availability limits.
What usually drives the move to multiple nodes and a GPU pool?
Common triggers are: a peak that won’t fit on one node without queues and a drifting p95; multiple models or modes interfering on one GPU; and a requirement for high availability so you can update or repair without downtime.
How do I prevent long requests from clogging the queue and breaking p95?
Split traffic at least into “fast” interactive and “heavy” background paths; otherwise long generations will push others out. Add priorities and per-key limits so one client can’t hog the queue and degrade service for everyone.
When should I adopt Kubernetes and when is something simpler OK?
If you have 2–3 servers, rare releases, and no strict rolling-upgrade requirements, simple process/container management can be enough. Kubernetes pays off when you need to run many inference instances, perform safe rolling updates, autoscale by metrics, and isolate services and teams.
Why can the service be slow even if the GPU seems sufficient?
Because the bottleneck may be outside generation: RAG search, reading dialog history, tokenization, logging, or storage I/O. Break down latency by stage before buying GPUs, or you risk fixing the wrong bottleneck.
What mistakes are most common when scaling LLM inference?
Typical mistakes: planning by average instead of peaks and tails; adding hardware without queues, concurrency limits, and backpressure; using a single queue for varied request complexity; and not calculating cost per 1,000 requests or budget limits—these lead to unstable behavior despite increased capacity.