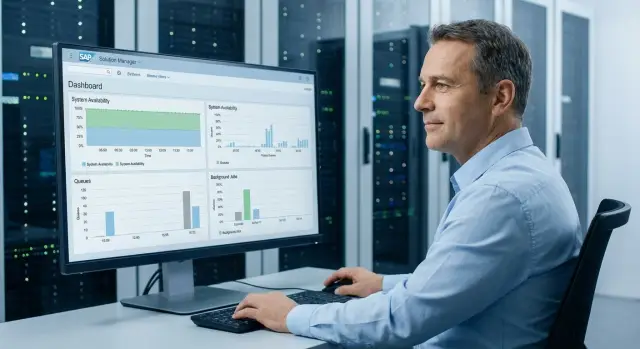
SAP Solution Manager monitoring: scenarios and how to start small
Monitoring in SAP Solution Manager keeps SAP stable and helps plan changes: which control scenarios to pick and what data to collect when you start small.
Why operations need monitoring for the SAP ecosystem
When users say “everything works”, that usually means only one thing: nobody is complaining right now. For operations that isn’t enough. A system can remain “up” while quietly accumulating problems: database space runs out, update queues grow, background jobs hang, and a key interface slowly degrades.
Monitoring in SAP Solution Manager helps you see not only an incident but its early signs. Then response becomes planned: you fix the root cause before it hits a business process.
Common early symptoms include: increased response time (first in one module or for one user group), errors and retries in interfaces (IDoc/RFC/PI/PO), growing backlogs in background jobs and locks, full file systems and logs, and new dumps or error spikes after updates.
Three things usually block getting started.
First — no owner: it’s unclear who decides that a signal is important and who acts on it.
Second — no thresholds: data is collected “about everything”, but it’s unclear where the alert threshold is.
Third — no baseline: without history it’s hard to tell normal from degradation.
“Start small” means not doing a big project but selecting a limited set of signals and turning them into actions. For example: one productive system, 5–10 indicators, clear thresholds and a reaction rule (who watches, how often, what they do next).
A practical example: after a couple of slow-processing incidents the team records several key symptoms (response time, update queue, interface errors), collects a week of history and sets simple alerts. In a month a steady rhythm appears: problems are found by trends, and changes are planned based on real load rather than guesswork.
What SAP Solution Manager covers in monitoring
Think of monitoring in SAP Solution Manager as a single “umbrella” over the SAP environment: from individual systems to the links between them. It’s useful not only for answering whether something is immediately critical, but for early signs of problems that users haven’t noticed yet.
Typically three groups are under control: the SAP systems themselves (ABAP, Java, HANA, databases), background jobs and queues, and interfaces/integrations (IDoc, RFC, PI/PO, web services). Importantly, this is not a replacement for admin tools but a single view where events are normalized to common rules and thresholds.
It’s helpful to separate observation and control in advance.
Observation — collecting data, statuses and trends.
Control — the reaction: notification, incident creation, procedure run, change approval, root cause recording.
If you set up only collection, the team will see “red lights” but won’t know who does what next.
Keep three levels of control in mind:
- Technical: availability, load, infrastructure errors, growing logs, HANA and host health.
- Application: business queues, IDoc errors, failed background jobs, processing delays.
- Process: reaction speed, quality of incident closure, recurring causes, adherence to maintenance windows.
Monitoring works “in real life” when each signal has an owner and a clear action. For example, “the nightly job to load exchange rates failed” should go not only to admins but also to application support with a clear SLA.
A practical scenario: accounting has no data in the morning, and monitoring shows that an RFC to an external system began responding slower during the night. The technical level provides the fact and start time of degradation, the application level shows the error queue, and the process level records that the incident went to the right group and was closed with a cause.
If you don’t have a dedicated SolMan team, it’s useful to agree roles and routes: who acknowledges an alert, who fixes it, who decides on escalation.
Useful control scenarios: fastest wins
Fast wins come not from “everything at once” but from controlling what affects business processes daily: availability, delays, interface errors and resource bottlenecks. These signals most often catch incidents before users notice them.
1) Availability and the “liveliness” of key components
Start with a simple question: is the system available and responsive? Check ABAP, SAP HANA, SAP Gateway and entry points like Web Dispatcher separately. Useful are not only up/down checks but signs of degradation: growing connection errors, frequent restarts, hung processes.
2) Performance that users feel
Focus on user experience: response time, dialog load, request queues, throughput. A good starting practice is to alert when response time rises not for a minute but is sustained for 10–15 minutes. This filters out transient spikes while catching sustained issues.
For a start a few clear scenarios are usually enough: slower dialog steps and increased transaction response time, entry errors (Gateway, Web Dispatcher), filled key queues and more hung tasks, sustained CPU and memory growth, free disk space and growing logs/table space.
Batch processes yield quick benefits too: background jobs that run past their window, chain errors, spool problems. A typical example: a night-end financial run shifted by 40 minutes due to a queue and lack of log space, causing morning slowdowns and unavailable reports.
Don’t miss integrations: RFC/IDoc errors, hung queues, repeated messages. Also keep basic security checks: spike in failed logins, mass account locks, critical role changes. These often reveal issues earlier than they are reported to the service desk.
How to choose 5–10 signals to start with
Monitoring shouldn’t start with hundreds of metrics. In the first 2–4 weeks it’s more important to pick 5–10 signals that reflect availability of key processes and lead to clear actions: what to do, who and within what time.
First, make a short list of critical services. These are systems and integrations that must stay green: productive ERP (PRD), central DB, SAP Gateway/ICM, main interfaces (for example, bank exchange or EDI), printing, authentication (SSO, LDAP, AD). If the service stops and work stops — it’s on the list.
Priority matrix: 24/7 or daily review
To avoid drowning in events, distribute signals into two modes.
For 24/7 typically keep: login/critical component availability, free space on critical file systems, RFC/IDoc errors, critical background job failures and delays in queues or integrations.
For daily review fit: growth and capacity trends, trends in slow dialogs/SQL, backup completion, update and patch status, overall memory and disk forecast.
Add “user-facing measurement points.” Even when infrastructure looks healthy, users can suffer. Pick 1–2 simple scenarios: login and running a basic transaction (for example, opening a document list or a directory). In SolMan this is convenient to record as regular checks with a clear threshold: “login > 20 seconds” or “transaction fails to open within 60 seconds”.
Each signal must have an owner. Otherwise an alert will be ownerless. Typical split: Basis for SAP instances and background tasks, DB admins for backups and DB performance, application team for critical jobs and app errors, integration team for RFC/IDoc/queues.
The final step — agree response times and escalation. For 24/7 clear rules suffice: who takes the first alert, after how many minutes the next line is engaged, and where status is recorded (a single chat or the service desk). This turns metrics into manageable support rather than noise.
What data to collect for stability and planning
For monitoring to actually help operations, data must answer two questions: “is the system alive?” and “what changed before the problem?”. It’s better to start with a small number of signals but collect them regularly and consistently for key systems (DEV, QAS, PRD).
Minimum set for stability
Begin with what most quickly shows the risk of downtime and quiet problem buildup:
- Availability and health of key components (application, database, links between systems).
- Signals about background jobs and chains: what didn’t start, what hung, what runs noticeably longer than usual.
- Queues and accumulations (including integrations): size growth and recurring errors.
- Database and storage growth: total volume, growth rate, fill level so you don’t hit a cap unexpectedly.
- User symptoms: spikes in failed logins, rise in RFC/integration errors, unusual share of canceled dialogs.
This is enough to catch most “fires” and to see where things will be worse tomorrow.
Logs, errors and performance: what to record for investigations
Alerts alone aren’t enough. You need traces that explain the cause: short dumps, application system logs, update errors and recurring interface messages.
For performance collect not “everything” but a few measures the team can easily understand: average dialog time, share of long operations, locks and waits, and signs of heavy database queries. These help distinguish “really slow” from “many users during peak”.
Change data and load calendar
For change planning record history: who moved what and when, which transports were included, how import went and what errors appeared immediately after. A good practice is linking changes to incidents: “after the evening import update errors grew”.
Add a single release/calendar of maintenance windows and load peaks (for example, month-end). Then a growth in response time at the end of the day is not a mystery but an expected peak.
Retention rules
Agree retention times immediately: detailed data can be kept short (for example, 7–14 days to analyze recent incidents), while aggregates and trends should be kept longer (for example, 3–6 months) for capacity planning and to see whether things are getting worse.
How to start small: a 2–4 week step-by-step plan
Start monitoring in SAP Solution Manager as a pilot rather than a large project. The goal for the first 2–4 weeks is simple: connect key systems, capture 5–10 clear signals and agree who and how reacts.
Work plan by weeks
Begin with a short inventory: which systems are in the landscape (PRD/QAS/DEV, PI/PO, BW, HANA), which critical interfaces and business processes, and who owns each area (Basis, ABAP, integrations, network, DB). This immediately removes the classic problem “there is an alert but no one to respond”.
Then proceed like this:
- Week 1: connect systems to SolMan and enable basic alerts for availability and performance (without fine-tuning thresholds).
- Week 1–2: enable background job and queue monitoring and interface monitoring (IDoc/qRFC/tRFC/HTTP depending on your environment).
- Week 2: define first thresholds and agree review schedules: short daily checks, weekly summary, monthly trend.
- Week 2–4: run the pilot, mark noisy alerts and adjust thresholds and exceptions.
- By pilot end: document the reaction procedure and a short guide for the on-call shift.
To get value from the pilot, record not only triggers but context. A simple log (a table or tickets) is enough: what triggered and on which system, was there user impact, cause (if found), recovery time, and whether the threshold or reaction rule needs change.
Mini guide for the on-call shift
Make it one page: which 5–10 signals are critical, how to check for false positives, when to escalate to an owner and where history of decisions is stored. In practice this reduces reaction time more than “perfect” threshold tuning.
Monitoring for changes: releases, transports, maintenance windows
Changes in SAP usually “shoot” not because of code but because of timing and conditions: high load, clogged queues, lack of resources on apps or DB. Therefore tie monitoring to the release calendar and maintenance windows rather than keeping it as a separate panel.
Before a change window collect a short snapshot of current state. It’s important to see not only green lights but what is already close to thresholds: current load (dialogs, RFC, background), queues and delays (job/update/spool backlog, integration queues), free resources (CPU/memory/disk, especially /usr/sap and log files), critical service availability (ICM/HTTP(S), SAP Gateway, RFC destinations) and system hygiene (system log, dumps and their dynamics after recent changes).
Transport control is better made measurable. Minimum — record what went to production, when, who approved it and what rollback plan was agreed. A practical form: “release - list of transports - import time - result - responsible - rollback note”.
After a release you need checks that catch issues before users do. Usually 3–5 beacons are enough: one or two key transactions, one typical integration and a couple of background chains (for example, nightly calculations or loads). If failures occur, comparing before and after is more important than arguing about impressions.
For incident reviews keep snapshots: at least 30–60 minutes before the window, during import and 1–2 hours after. Save threshold metrics, error and dump counts, top heavy queries or reports and queue states.
Use early warnings such as EWA (EarlyWatch Alert). They show trends and quiet risks (dialog time growth, update issues, file system fill) before the next release.
Typical mistakes and traps when setting up control
The first trap — do everything at once. In SolMan teams connect dozens of metrics, get hundreds of alerts a day and quickly stop reacting. The rule is simple: better 10 signals the team reliably responds to than 200 “for show”.
To cut noise, start with alert hygiene: remove duplicates (one symptom should not come from three sources), tie alerts to actions (if it’s unclear what to do, it’s not a useful signal), separate priorities (now vs business hours), silence planned windows (backups, routine jobs) and weekly-clean the noisiest metrics.
Second mistake — no metric owner. There is a signal but no decision: Basis thinks it’s development, development thinks it’s integration, business thinks “IT will handle it”. Each metric must have an owner and a clear escalation path. A good test: who closes the incident if the threshold has been red for 30 minutes?
Third trap — thresholds “from the ceiling”. Without a baseline you either catch false positives or miss degradation. First collect 1–2 weeks of observations, mark peaks (month end, nightly loads, batch windows), and only then set thresholds. Often trends work better than fixed thresholds: “has been rising for a week”.
Fourth mistake — monitoring only servers. Many SAP failures don’t start with CPU but with queues, background jobs, RFC, IDoc, interface errors, stuck print jobs and overloaded log tables. These issues hit users first.
Fifth trap — no link to incidents. Data is collected but not used in root cause analysis. A minimum that pays off quickly: for each P1/P2 record which metrics were red before the outage, which turned red after, and which signal could have warned in advance. Then monitoring becomes a stability tool, not just a dashboard.
Short operations checklist: what to check and how often
A checklist helps you catch real risks daily instead of noise from secondary warnings. Better to have a short set of checks the team performs on schedule and records deviations.
Daily (10–20 minutes)
Check what affects availability and the morning users: is the system alive, are there critical red alerts and are background processes failing?
- Availability of key systems and services (application, database, queues RFC/IDoc, gateway).
- Red alerts in Technical Monitoring SolMan and their dynamics (new or repeating).
- Failed jobs: backups, scheduled reports, loads, BW/PI/PO chains (if present).
- Queues and hangs: SMQ1/SMQ2, IDoc backlog, growth in background job execution times.
Weekly (30–60 minutes)
Weekly check trends: where debt is accumulating and what might “blow up”.
- Top interface errors (IDoc/RFC/HTTP), which repeat and why.
- Database growth: total volume, growth rate, large tables, file system fill.
- Response stability: dialog time growth, peak hours, frequent timeouts.
- Background processing quality: average run time of important jobs, queues, locks.
Before and after a release
Before a release ensure there is resource headroom and a clear rollback plan. After a release quickly confirm vital processes run as usual.
Before a release check free resources (CPU/memory/disk), queues and backlog, agreed window and rollback sequence.
After a release check key transactions, integrations and background chains and compare response to the baseline before the change.
Monthly (for planning)
A monthly review turns monitoring into arguments for capacity and budget: what is growing, when will capacity end, and which changes will need more power.
Collect load and capacity trends: user and batch load growth, CPU/memory usage, DB and storage growth rate, and a list of recurring incidents to permanently remove.
Example scenario: how a team starts control without a big project
The operations team is responsible for SAP ERP on ABAP, a HANA database, several external integrations and nightly batch jobs. Previously they reacted “as it happened”: users complained, the on-call checked SM37 and queues manually, and the cause had often already cooled down.
They decided to start small and configure monitoring in SAP Solution Manager only for what most often breaks the morning work. In the first sprint they chose five signals that are easy to explain to the business and quick to check:
- Availability of key components (ABAP, HANA) and response time.
- Growth of IDoc queues (accumulation and “sticking”).
- Three critical nightly jobs: completion and duration.
- Disk fill and HANA DB growth rate.
- Log growth and sudden increases in application/system logs.
After a week they found the first issues. Once the IDoc queue hung due to a partner error: data didn’t go out, but users noticed only in the morning. They also discovered steady DB growth: space was enough “today” but would run out in a month. One nightly job occasionally failed due to an integration timeout and in SM37 it looked like a one-off.
They did not broaden scope; instead they improved the reaction. The IDoc queue threshold was changed from “0” to a dynamic rule: alert if growth persists 15–20 minutes. For jobs they added “duration +30% of average” and an alert if a job started but hadn’t finished by the checkpoint time. Notifications were tiered: on-call immediately, integration owner only on repeat.
For change planning the same data became the basis. Based on disk and DB growth they scheduled a maintenance window and ordered extra storage in advance. Statistics on nightly jobs helped pick a safe time for releases and transports so they didn’t fall into peaks or break morning calculations.
Next steps: how to grow monitoring and who can help
When the first 5–10 signals work and the team is used to reacting, it’s important to lock that in and grow monitoring in a controlled way.
Put together a short document (1–2 pages) listing the systems you monitor: PROD, QAS, DEV, SAP HANA, SAProuter, Solution Manager, integrations and key interfaces. Next to each record the starter signals and thresholds. This removes arguments like “do we monitor this or not” and helps newcomers ramp up faster.
Then assign owners and SLAs for each alert type. Not “SAP in general” but specific: who acknowledges, who resolves, and what is normal reaction time at night and during the day. A simple split into critical alerts (immediate) and warnings (business hours) often prevents team burnout.
Agree how you store data and report to the operations manager. Two formats usually suffice: a short weekly status (what was critical, causes, actions taken) and a monthly trend report (growth, recurring failures, recommended configuration or infra changes). Decide retention policy upfront so you can prove trends with facts later.
A 3-month expansion plan should be small steps: add 2–3 control scenarios per month and close the loop (thresholds, owners, reporting, incident reviews).
If external help is needed it’s typically methodological (scenario selection, threshold tuning, SLA agreements, training on alert handling) or infrastructural (capacity for SolMan, DB and metrics storage, 24/7 support organization). In Kazakhstan the infrastructure part can be handled by a system integrator and hardware vendor such as GSE.kz, including servers and storage for SAP and round-the-clock technical support.