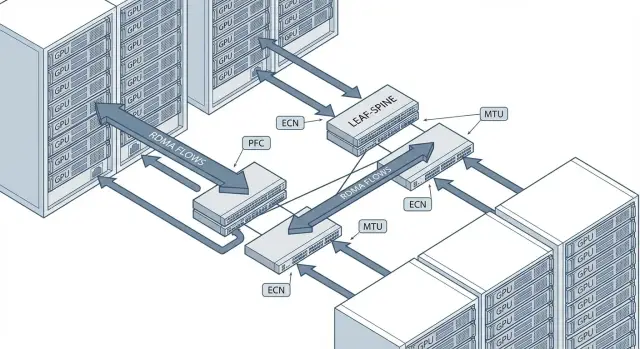
RoCEv2 for GPU Cluster: Network Setup and Pre-ML Checks
RoCEv2 for GPU clusters: what to set in PFC, ECN and MTU, which metrics to collect and how to check losses, latency and jitter before starting training.
What can go wrong with RoCEv2 in a GPU cluster
RoCEv2 is often chosen in GPU clusters for fast collective operations (all-reduce, all-gather) and stable gradient transfer between nodes. When the network behaves poorly, training doesn't just slow down — it becomes unpredictable: the same model may run normally one time and suddenly drop in throughput the next.
Problems often manifest as "mysterious" computation failures while the root cause is the network. Typical symptoms:
- drop in RDMA stream throughput and degraded all-reduce performance;
- increase in retries/timeouts and latency spikes;
- periodic hangs of individual GPU workers;
- unstable link utilization (one moment idle, next moment overloaded);
- "micro-pauses" that ruin iteration timing.
Important to understand: a “lossless network” for RoCE does not mean literally zero dropped packets in every counter. In a real fabric there can be best-effort traffic where drops are acceptable. For RDMA the critical requirement is different: avoid drops in the class carrying RDMA traffic and avoid driving the fabric into a state where PFC spreads pauses across the chain.
A typical scenario: you have 8 GPU nodes and training runs fine until a dataset upload or backup starts in parallel. If RDMA and "regular" traffic are mixed without clear QoS, queues form, ECN doesn't react correctly, and PFC begins pausing neighboring ports. As a result, one node lags behind and the whole group waits for the slowest.
Many issues are solved even before fine-tuning PFC/ECN/MTU. Decide early on speeds and architecture (e.g., 25/100/200G, leaf-spine), define L2/L3 boundaries and whether storage should be on a separate fabric or RDMA should use separate traffic classes. These decisions are almost always more important than last-minute "tuning."
Before you start: compatibility, topology and L2/L3 boundaries
RoCEv2 runs over UDP/IP, so it can operate across L3. But RDMA has stricter loss and latency requirements than ordinary traffic. First verify that the hardware and network design actually support the required congestion control mechanisms.
Start with compatibility on two levels: the server NICs and the switches. On the NIC it's critical that RoCEv2 is supported and ECN handling works correctly (and PFC if you plan to use it). On the switches, queues and priorities matter: ECN marking on the correct queues and predictable PFC behavior for the chosen class.
Next, define L2 and L3 boundaries. PFC is an L2 mechanism (pause frames) and does not traverse routers. If you run RoCEv2 across L3, rely on ECN and end-to-end congestion control, and use PFC only inside L2 segments where you control settings and buffers. In leaf-spine setups this often means L2 within a rack or pair of racks, and L3 beyond that.
It's almost always beneficial to isolate RDMA traffic: a dedicated VLAN, and in large networks a separate VRF. This makes it easier to maintain isolation, manage QoS, and avoid surprises from broadcast or control protocols in a shared segment.
Before touching PFC/ECN, lock down the basic QoS model:
- how many classes are needed (minimum: RDMA and regular traffic);
- what PCP/DSCP will RDMA use and who sets it (host or switch);
- which switch queues map to those classes;
- where PFC is allowed (only on the RDMA class);
- where ECN marking is enabled (usually on the RDMA queue).
Finally: a unified addressing plan and a single MTU along the full path. RoCEv2 only needs one "narrow" link to cause fragmentation, unexpected losses and performance drops before the first training run.
MTU and jumbo frames: how to set it without breaking the path
For RoCEv2 in GPU clusters, MTU is usually set consistently and large to reduce overhead and the risk of micro-losses at high load. Typical choice is MTU 9000 (on some switches this appears as 9216 at L2) — the idea is a frame should pass intact from GPU server to GPU server without fragmentation.
MTU must match across the entire path. One forgotten segment at 1500 bytes (VLAN, bond, uplink, SVI or an intermediate switch) will cause strange symptoms: intermittent RDMA timeouts, throughput drops and floating jitter.
Check and standardize MTU as part of your configuration:
- hosts: physical interfaces, bonds/teams, VLAN interfaces, bridges (if any), and overlays (if using VXLAN/Geneve, etc.);
- switches: MTU on access ports and uplinks, port-channels and SVI (if L3 is terminated on the switch);
- transit: any cross-room/cross-rack links and devices that might still be at default MTU.
How to verify MTU end-to-end
Do an end-to-end "DF" (don't fragment) test between two nodes in the RoCE domain and find where the frame is cut. On Linux start with ping and reduce the size until it passes:
ping -M do -s 8972 <IP_соседа>
If the packet doesn't pass, reduce the size in steps (e.g., minus 200, then binary search) and watch port counters in parallel: errors/drops/giants. Jumbo frames give gains but require discipline: any MTU mismatch breaks the path. It's better to lock the standard in config templates and checks before bringing a cluster online.
PFC: enable it only where needed
PFC (Priority Flow Control, 802.1Qbb) is a pause not for the entire port but for a selected traffic class. Ethernet Pause (802.3x) stops all traffic on the port and can cause the whole link to stall. PFC is useful for RoCEv2 because RDMA handles losses poorly, but PFC has a cost: misconfiguration can throttle the fabric, spread latency and create head-of-line blocking.
Main rule: enable PFC only for the single priority that carries RDMA, not "every priority just in case." Typically one 802.1p priority (e.g., PCP 3 or 4) is dedicated to RoCE and only that priority has PFC enabled. Other traffic (management, storage, regular east-west) should operate without PFC — otherwise any overload will trigger a cascade of pauses.
For predictable PFC, markings must survive from host to switch and back. Hosts often mark RDMA packets with DSCP, which is mapped to PCP at L2. Verify the DSCP->PCP mapping on the NIC/driver and on switches, and ensure trunk policies don't clear or rewrite tags because of trust boundaries.
Before enabling PFC on ports follow a short checklist:
- choose one priority for RDMA and enable PFC only on that priority on every port along the path (server ports and inter-switch links);
- configure consistent trust for markings (trust DSCP or trust PCP) so classification is uniform across devices;
- check PFC buffer thresholds and pause levels considering link speeds and fabric latency: on 100G/200G a pause can quickly fill buffers if thresholds are too high;
- ensure the same priority has the correct egress queue and no accidental shaping.
After that, "read PFC from the counters." On switches and NICs monitor at minimum:
- PFC Rx/Tx frames for the priority: rare events under peaks are acceptable; steady growth indicates overload;
- PFC pause duration (if available): long pauses mean queues aren't draining;
- drops in the RDMA class: if drops happen with PFC active, thresholds/buffers or classification are wrong;
- ECN/marks (if enabled): if there is no ECN but PFC increases, you are treating overload only with pauses.
A simple real-world mistake: enabling PFC on all eight priorities "just in case." When a backup or heavy east-west transfer starts, pauses fire not only for RDMA and latency spikes across the cluster. Restricting PFC to the RDMA priority and aligning DSCP/PCP usually makes the problem disappear and PFC counters become rare and interpretable.
ECN and congestion control: avoid micro-losses
In RoCEv2 packet losses often begin as micro-losses in queues during bursts. For training this looks like rare but painful throughput drops and longer iteration times. ECN helps by signaling senders early while buffers still have room.
PFC and ECN solve different problems. PFC provides lossless behavior at L2 but can cause head-of-line blocking and cascades of pauses. ECN is softer: the switch marks packets as queue grows and the hosts reduce send rate. Ideally PFC is a safety net for the RDMA class and ECN handles most congestion control.
Enable ECN marking on the switch for the RDMA queue (a separate QoS class/priority). Set marking thresholds correctly: an early threshold to start marking and a higher threshold for more aggressive marking. If thresholds are too low, marking will occur even on light loads and reduce utilization. If too high, you'll still see losses and PFC pauses.
On hosts ensure ECN handling and a congestion control algorithm for RoCEv2 are active (commonly DCQCN or the vendor NIC's equivalent). Without host-side reaction, switches may mark correctly but the sender won't throttle.
Practical checks before launch:
- run background load and short bursts (similar to all-reduce) and observe the share of ECN-marked packets and RDMA speed dynamics;
- make sure PFC pause frames are rare, not constant (otherwise you're treating congestion with pauses);
- verify that ECN doesn't noticeably throttle performance on an otherwise empty network;
- collect queue/drop counters on fabric ports and ECN/CNP counters on NICs.
If the fabric is heterogeneous (different switch models), align ECN profiles in advance. Identical numeric thresholds can behave differently due to buffer size differences. It's more practical to aim for the same metric outcomes: few pauses, no drops, and moderate marking only during bursts.
QoS and queues: how to separate RDMA and "regular" traffic
Networks break more often not from MTU or PFC per se, but because RDMA shares a queue with backups, logs and service noise. When background flows fill buffers, micro-losses and latency spikes occur and later show up as "strange" training slowdowns.
A QoS policy that usually suffices
Map traffic to classes and bind classes to queues (via 802.1p/PCP or DSCP depending on your design). A common split is:
- RDMA (RoCEv2) — dedicated queue;
- storage (e.g., distributed storage) — separate queue without PFC;
- management and control (SSH, monitoring, cluster agents) — separate class with a guaranteed minimum;
- everything else — best-effort.
Beyond prioritizing RDMA, limit background traffic. Shaping/policing at access ports (where noisy sources live) is often better than trying to cure congestion on the fabric. The goal: prevent backups or large copies from occupying buffers and triggering a cascade of pauses.
Where rate-limit helps and where it hurts
Rate-limiting is useful on server inputs with unpredictable best-effort traffic and on service ports that can unexpectedly generate heavy load. On uplinks or ports carrying RDMA, blunt policing can worsen latency and cause jitter even without packet loss: packets will queue and be released in bursts.
Ensure RDMA priority doesn't starve management: leave a small guaranteed minimum for control class and verify via queue counters that it receives bandwidth. Document marking rules: which PCP/DSCP hosts set, what classes switches expect, and where trust is applied (host, ToR, aggregation).
Which metrics to collect before training: hosts and switches
Before training capture a baseline: how the network behaves idle and how it behaves under typical RDMA load. This helps separate network issues from application problems faster.
Host (GPU node) metrics
On hosts the goal is to find losses, retries and pauses and where they occur (NIC, queues, driver):
- RDMA counters: retries/retransmits, timeouts, CQ/QP errors, ECN reaction (if the stack reports it). Rising retries under normal load almost always indicates micro-losses or overload;
- interface stats: drops, errors, FCS/CRC, overruns, missed, and per-queue errors (TX/RX queues). Even small FCS errors often point to cabling/optics or a bad port;
- PFC on the host: how many pause frames sent/received and on which priorities;
- utilization: link utilization, throughput in both directions, queue distribution. Confirm RDMA indeed maps to the intended QoS class;
- latency and jitter: p50/p95/p99 on application and network tests. For training tails (p99) are often more critical than averages.
Switch metrics
Switches should confirm they are not dropping packets in queues or entering long pause states:
- drops per queue and per priority (especially RDMA class). Zero drops under load is a good sign;
- PFC pause: count and duration by class. Growing pauses with filling buffers mean head-of-line risk;
- ECN marks: how many packets are marked. ECN should rise under load while host retries remain controlled;
- buffer occupancy (if available): how full buffers are per port/queue — the best indicator of hidden congestion;
- port utilization and microbursts: peak usage and asymmetry. Problems are often in short bursts, not average traffic.
Collect metrics twice: 5–10 minutes idle, then under a load similar to real training (number of streams, message sizes, all-reduce pattern). Then compare where retries begin, which ports show ECN marks and whether that aligns with p99 latency and jitter growth.
Step-by-step checks for losses, latency and jitter
Do checks before the first training run. RoCEv2 issues often appear as rare micro-losses and long latency tails rather than total outages.
Quick verification plan (before ML)
-
Start with the physical layer: ensure speed and duplex match, no flaps, rising error counters or FEC issues. A common jitter cause is marginal optics or DAC cable that "seems to work" but is at the limit.
-
Verify MTU end-to-end across server, ToR and aggregation. It's not enough to set jumbo frames; ensure no hidden fragmentation.
-
Run RDMA tests between pairs and in all-to-all patterns. Pairs expose point issues; all-to-all quickly reveals hot directions and uplink congestion.
-
Create a controlled overload and observe PFC and ECN behavior. The goal is not to crash traffic but to see pauses and marks rise while loss remains absent in the lossless class and there is no avalanche of pauses across other classes.
-
Measure tails (p99, p999) and jitter. For training the tails matter: rare latency spikes can slow iterations more than a small average throughput drop.
Tools and what to record as "golden"
Minimal set of commands typically:
# MTU without fragmentation (adjust size to your MTU)
ping -M do -s 8972 <ip>

# RDMA latency/bandwidth (example using perftest)
ib_write_lat -a <peer_ip>
ib_write_bw  -a <peer_ip>
If a pair A-B shows good latency but all-to-all p999 jumps near one ToR, that usually points to an overloaded uplink or incorrect queue/QoS there.
Finally save results as a golden baseline: driver/firmware versions, MTU, QoS settings and key metrics (drops, PFC pause, ECN marks, p50/p99/p999). This speeds up root-cause analysis after updates or cluster expansion.
Common misconfigurations in RoCEv2 and quick ways to find them
Most problems present as "training got slower" or "collectives occasionally hang." Below are frequent mistakes that cause hidden losses, pauses and unstable latency, and how to narrow them down fast.
PFC: global pauses and wrong class
The worst mistake is enabling PFC everywhere across multiple priorities. Result: pauses spread through the fabric and one overloaded port slows many flows.
Another common issue: PFC is enabled but RDMA isn't mapped to the right priority because of incorrect marking (DSCP/PCP) or mismatched QoS policies on host and switch. Quick sign: PFC counters climb while queue drops still occur.
MTU and ECN: "almost working" but slow
An MTU mismatch on one segment (host, ToR, inter-switch link) often doesn't break connectivity outright but causes fragmentation, extra CPU work, RTT spikes and throughput loss. If one node is consistently worse, MTU is a top suspect.
ECN mistakes fall into extremes: too-low thresholds cause constant throttling (low utilization); too-high or inconsistent settings cause micro-losses in queues. Compare ECN-marked counts, queue sizes and actual drops.
A short diagnostic that usually points the way:
- on switches: drops/overruns per queue, PFC pause frames and pause time, ECN-marked, buffer fill levels;
- on hosts: NIC errors, RDMA retrans/timeout, real port speeds, QoS counters by class;
- load: test realistic multi-stream profiles, not a single flow;
- isolation: temporarily separate noisy traffic (storage, backups, updates) from RDMA by queues;
- comparison: find a "good" and "bad" node and compare marking and MTU along their paths.
In practice maintain a reference config for typical nodes (e.g., a GPU rack and its ToR) and check deviations before bringing new hardware into the cluster.
Short pre-training network checklist
Before handing the cluster to training, run a quick network hygiene check. Predictability matters more than peak numbers: avoid hidden losses, pauses and latency spikes.
Verify basics across the path (NIC - ToR - spine - ToR - NIC):
- identical MTU, speed and FEC settings on all links; no CRC/FCS errors, symbol errors, flaps or other physical indications;
- RDMA traffic is consistently marked (DSCP/802.1p) and maps to the dedicated queue, not mixed with regular traffic;
- PFC is enabled only for the required class carrying RDMA, PFC counters don't grow steadily and there's no sign of pause-storms;
- ECN is enabled for the RDMA class and only highlights congestion (no constant marking on normal load);
- no drops on switches or NICs in the RDMA queue (and no WRED/tail-drop where it shouldn't trigger).
Then check behavior under load. Test all-to-all and parallel flows because training behaves that way:
- latency and jitter remain stable in all-to-all tests at target load: no periodic "saws" or rare peaks that align with PFC/ECN spikes;
- under background traffic (management, storage, monitoring) RDMA queue stays predictable: metrics do not degrade sharply.
If any item fails, don't start training on a hope. Fix it first: usually one MTU/QoS mismatch or PFC enabled too widely is the culprit.
Example rollout scenario and next steps for bringing the cluster online
Example: 16 GPU servers, 2 leaf switches and 1 spine, uplinks and host ports at 100G. RDMA is on a separate VLAN (and a dedicated QoS priority); management and storage traffic are isolated. The goal before the first training run is to ensure the fabric behaves predictably: no losses, no PFC sticking, no latency spikes.
Do verification in stages, recording the baseline after each stage:
- 2 nodes: RDMA bandwidth/latency tests, MTU check across path, basic port counters;
- 4 nodes: parallel streams, fairness checks and absence of micro-losses under load;
- 8–16 nodes: collective patterns (all-reduce/traffic matrix), simulate real training profile and add background regular traffic;
- overnight/long run: 2–6 hours to catch rare events (bursts, periodic drops).
After each step watch for red flags and their dynamics:
- drops/discards on ports (especially with PFC enabled) and rising per-queue errors;
- excessive PFC: many pauses, long pauses or PFC affecting non-RDMA classes;
- rising retries/RNR NAK on RDMA and falling effective throughput under steady load;
- ECN: too many markings coinciding with latency spikes (wrong thresholds or buffer overflow);
- jitter: rare latency spikes that coincide with PFC events or egress queue bursts.
Summarize results in a short 1–2 page report: (1) baseline (2 nodes), (2) cluster load test, (3) deviations found and root causes, (4) remediation plan with priorities and retests.
If this is your first RoCEv2 cluster or NIC/switch profiles are uncertain, independent validation of the fabric and network profiles before the pilot is useful. A systems integrator like GSE.kz (gse.kz) can help define architecture, QoS models and stop-criteria in counters before training begins.