Revit Performance Testing for Your Workflows: Scenarios and Metrics
Revit performance testing: which scenarios to run (opening, regeneration, export), which metrics to record, and how to compare PCs before purchase.
Why measure Revit performance before buying hardware
Revit stresses a computer in different ways than a “general” benchmark. In one office the main bottleneck is heavy views and frequent regeneration; in another it’s export, printing, or working in a shared model. So other people’s results can be misleading: they don’t use your models, your plugins, or your workflow.
Measurements answer a simple question: where are you losing time. Sometimes a pricier GPU changes almost nothing, while a higher CPU clock or a fast SSD gives noticeable gains. Other times you’re limited by graphics and drivers on complex 3D views.
After testing teams usually decide what’s more cost‑effective:
- buy an office PC or a BIM workstation
- invest in more RAM, a different CPU, or a faster drive
- dedicate a separate machine for rendering and visualization
- standardize configurations for the team to simplify support
One more important point: “identical specs” on paper don’t always mean identical Revit performance. Different CPU generations, power settings, memory (frequency and timings), cooling (throttling) and even GPU driver versions can change operation times by tens of percent.
Simple example: two PCs with 32 GB RAM and similar CPUs can behave differently because one sustains high clocks under load while the other drops frequency due to weak cooling. A short test before purchase reveals such issues. If you’re buying many machines, it’s convenient to compare options on your models and then choose ready configurations from a local vendor or integrator like GSE.kz.
Preparation: make results fair and comparable
The goal of preparation is to remove random factors. Otherwise you compare not computers but different conditions: versions, graphics settings, background updates and power mode.
Same Revit environment. Lock the Revit version and build. If one PC has a hotfix and the other doesn’t, opening and export times may differ noticeably. The same goes for plugins: either use the same set or disable extras during tests.
Same project and graphics settings. Test on the same model and views with identical display parameters: detail level, shadows, anti‑aliasing, category visibility, view style. One checkbox for shadows can easily kill FPS and skew GPU results.
Same system conditions. Check Windows power plan (preferably maximum performance), GPU driver versions and free disk space. Laptops should be tested only while plugged in.
Before each run, a short checklist helps:
- reboot the PC and wait 2–3 minutes
- disable syncs (cloud, mail, messengers)
- close extra browser tabs and heavy apps
- ensure power and drivers haven’t changed
- open Revit and “warm up” caches with one idle model open
If you compare two workstations before buying (for example, for projects under a public contract in Kazakhstan), use the same test set and protocol. Then second differences in seconds reflect performance, not randomness.
Choosing test models that match your real projects
To be useful, choose 2–3 models similar to your work, not a pretty demo file. Otherwise you may buy a PC that flies on simple scenes but chokes on your templates and linked files.
It’s best if the set covers different load types. Architecture often stresses graphics and views, structural models can be heavy on element count, and MEP brings many families and dependencies. If you usually work with linked models, a test without links won’t say much.
Make sure files reflect your true complexity: roughly the same number of elements, views and schedules, typical families, your links (IFC/RVT/CAD) and your project template.
Decide whether you work solo or in collaboration. If you use a central model and Worksharing, include that in the test. Synchronization time depends not only on the network but also on how quickly the machine processes changes.
To compare two PCs fairly, fix the same set of operations in advance:
- open the project and 3–5 key views
- make a typical edit and wait for update
- refresh a schedule or sheet
- synchronize with the central model (if used)
- export to the format you actually deliver to clients
Scenario 1: opening the project and switching views
This scenario shows how fast Revit “gets ready” at the start of the day and what happens when you switch views frequently. It’s important to repeat the same actions under identical conditions.
Start with a realistic model: typical links (architecture, structure, MEP), your families and worksets. If you use a central model, test creating a local copy, loading worksets and the first view load.
Fix the step order and don’t change it between runs:
- open the project (locally and, separately, via the central model)
- wait until fully ready (no loading indicators, navigation is smooth)
- open several “heavy” views in a loop: plan, section, and a 3D with working detail
- close the project and Revit, then repeat to see the difference between a “cold” start and cached work
A normal pattern: the first load is heavier, subsequent opens and switches are noticeably faster. A red flag is long pauses every time, especially on the first 3D open.
If you compare two configurations for a department, record time to ready and time to first open of each heavy view. This quickly shows where the hardware “fails”.
Scenario 2: regeneration and interactive work
Here you see how quickly Revit responds to daily actions. The interactive experience is where you feel the difference between a “seemingly powerful PC” and truly comfortable work.
Take a typical view (plan, 3D or section) and repeat 3–5 habitual edits: move a wall, replace a family (door, equipment), change parameters. After each action, wait for full regeneration and record how many seconds you can’t work normally.
Also check operations often overlooked:
- applying a view template
- changing filters and visibility
- switching level of detail
- recalculating schedules and lists after edits
Add one “heavy” operation specific to your projects: group update, array recalculation, changes to dependent elements (rebar, annotations, etc.).
If you change a window type and immediately update a schedule, an 8–10 second delay per step quickly becomes hours lost. In the test, time such delays with a stopwatch and compare them across PCs using the same file.
Scenario 3: collaboration and synchronization
With Worksharing a “fast CPU” alone doesn’t guarantee comfort. Synchronization depends on the disk, network, latency to storage, workset settings and how heavy the changes are per user.
Test two modes: “peak” (several people syncing actively) and quiet time. The difference between these modes is often more important than the difference between two GPUs.
Mini‑protocol:
- open a local copy and connect to the central model
- do “Get Latest” and open 2–3 required worksets
- make a typical set of edits (for example, 20–50 small changes)
- run sync and record the time
- if possible, simulate a conflict (a colleague edits the same element) and see how quickly conflicts are resolved
Compare local and network/cloud scenarios. If times vary wildly, the issue may be infrastructure rather than the PC.
Practical case: two identical CPUs but one PC is noticeably slower during syncs. Often the reason is the SSD (slow writes) or the network path to storage. Knowing this before purchase helps allocate budget between PCs and network.
Scenario 4: export and production of documentation
Exports and documentation usually happen near deadlines when models are heavy. Include these operations in measurements: they show how a PC handles sustained load and whether there’s enough memory.
Don’t tweak settings just to be faster. Test with the same parameters you actually deliver.
What to run
Make 2–3 identical runs on each machine and take the average:
- DWG export for 1–2 sets of sheets or views with your layer mappings
- IFC export of the same model (IFC2x3 or IFC4 as you use)
- PDF printing: single sheet and a batch (e.g. 20–50 sheets)
- if part of your workflow: NWC/FBX/Datasmith from the same view or set
If producing 40 PDF sheets takes 12 minutes on one PC and 7 on another, the difference may seem small. Over many releases it becomes hours.
What to record
Log not only time but also signs of problems:
- operation time from click to finished file
- output file size (DWG/IFC/PDF) to ensure settings match
- peak RAM usage and whether paging starts (export slows sharply once swapping begins)
- stability: freezes, export errors, blank sheets, missing elements
If you select workstations for these tasks, ask the vendor to run your models with your protocol. That way, when comparing GSE.kz configurations, you’ll discuss numbers, not impressions.
Which metrics to capture and how
To make tests useful for hardware selection, record not only “how long you waited” but what you were doing at the time. Then you can tell whether you’re limited by CPU, memory, disk, or network.
1) Time by steps. Don’t say “opening took 2:30”; break it down: launch, model load, first view, 3D load, schedule update.
2) Responsiveness. After an action note how many seconds until you can pan, select elements and continue without stutters. Total time may be similar while the “feel” differs.
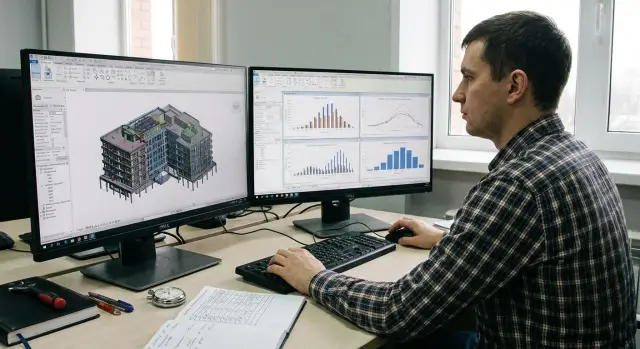
3) System metrics. Capture them with Task Manager and Resource Monitor:
- CPU: utilization and clock under load, signs of throttling
- memory: peak RAM, paging file growth, crashes
- disk: active time and read/write speed during open and export
- network (for central model): throughput drops during sync
- stability: freezes, repeated operations due to errors
A practical rule: do 3 runs of a scenario and treat the first as warm‑up. If CPU frequency noticeably drops after 5–10 minutes and responsiveness worsens, that’s a cooling or stability issue.
How to run a test: steps and a simple protocol
Comparisons must be identical and repeatable: the same actions, one scenario, multiple runs. Otherwise results aren’t comparable.
Mini run protocol
-
Close extra apps and disable auto‑updates for the test.
-
Reboot the PC or agree on a restart rule (for example, restart Revit before each group of operations: “open”, “regenerate”, “export”).
-
Reset caches the same way on all machines: either a cold start after reboot, or the same cleanup of Revit temp files (and collaborative cache if used).
-
Perform each operation 3 times. Record times, then compute average and spread (max‑min). Large spread usually means unstable conditions.
-
Pause 30–60 seconds between runs to let the system “calm down”.
Record results in a single table:
- PC (CPU, RAM, GPU, SSD type)
- Revit version and build, settings (e.g. hardware acceleration)
- model (name, size, source)
- operation and step (e.g. “export PDF, sheets 1–20”)
- times: run 1, 2, 3; average; spread
Set success criteria in advance based on the role. A designer values quick opens and view switches; a BIM coordinator values predictable regeneration and stable export times as the model grows.
Common mistakes and testing pitfalls
The main mistake is drawing conclusions from a single number. Focusing only on CPU clock or only on “GPU power” can lead to buying hardware that excels in one scenario and fails in others. Opens and regeneration often stress CPU and memory, while smooth 3D navigation depends on GPU and drivers.
The second trap is mixing conditions. One run with hardware acceleration on and another with different view templates, plugins or Revit updates makes numbers incomparable. Even worse is a background render, cloud sync or antivirus scan running on one PC during a run.
Testing a “blank” project is another issue. Such files open quickly on almost any computer and don’t show real load: heavy families, links, many views and large schedules.
Overheating is often overlooked. A laptop or small case can perform well for a few minutes and then drop clocks. Repeat runs and stability checks catch this.
Also, don’t measure Worksharing syncs over Wi‑Fi. An unstable network adds noise and hides differences between PCs.
Quick anti‑checklist:
- same file, Revit version, plugins and settings
- identical power plan and performance mode
- 2–3 repeats per scenario, record spread
- monitor temps and clocks during the test
- for Worksharing use wired network and the same access to storage
Quick checklist before procurement
Before signing off on a purchase, do a short run on 1–2 of your models. It takes under an hour but quickly reveals the bottleneck: CPU, RAM, drive or cooling.
Check and record:
- model opening meets target time and repeats 3 times with spread under 10–15%
- switching 2–3 heaviest views happens without 5–10 second “step” freezes
- after a typical edit regeneration is stable and doesn’t “drift” by the end of the run
- export (PDF/DWG/IFC/NWC — whatever you use most) gives predictable times and completes without memory errors
- RAM peaks don’t hit paging and CPU doesn’t drop frequency due to overheating (watch for speed decline after 5–10 minutes of repeated actions)
Two quick checks often decide the comparison: watch disk behavior during open and export for “stutters”, and estimate memory headroom. If typical work leaves less than 15–20% free RAM, model growth or an extra plugin will push the PC into swap.
Mini decision scenario: run the same actions on two PCs and compare not only average time but the worst run. Predictability matters in Revit: a PC that’s sometimes much slower will continually frustrate the team.
If you buy workstations or servers from GSE.kz, this checklist works as a simple acceptance protocol. It catches major risks before equipment is distributed.
Example: how a team compares two PCs on one project
A team tests two computers on a real case: one architect manages the model, two linked discipline models are connected, and they regularly need to produce IFC and a PDF set. They use the same workset, identical plugins and Revit version, disable background tasks and run scenarios on both PCs.
They record three runs and look at the average, not the best run. Typically the most time is spent on:
- first open (often limited by disk and memory)
- regeneration after edits and switching heavy views (depends on single‑thread CPU performance)
- IFC export (can heavily load CPU and memory)
Often the winner isn’t the most expensive GPU but a balanced base: enough RAM, a fast NVMe SSD, a CPU with sustained high clock, adequate cooling and reliable power.
After the runs they translate numbers into procurement specs: typical model size, list of operations (open, regenerate, IFC, PDF), target times (e.g. “IFC under 12 minutes”) and minimum RAM/SSD/CPU requirements. Purchases then rely on measurements, not guesses.
Next steps: turn measurements into a configuration choice
With results in hand, map the numbers to real bottlenecks and decide what to upgrade. The same computer can open models quickly but export slowly, or vice versa.
Collect 2–3 representative models and agree on a single run protocol. Then record a baseline on current machines: where it hurts (open, regenerate, export, sync) and by how much. Compare candidate machines using your metrics and always check not only the average but the worst run.
If you need help selecting workstations and infrastructure for your scenarios, share your protocol and acceptable time thresholds with the vendor. GSE.kz offers L200 and M200 series for workstations, and S200 for server and datacenter tasks. That way, the conversation focuses on your models and numbers, not an abstract “Revit benchmark”.