Quick Start Oracle Enterprise Manager: architecture and alerts
Quick start Oracle Enterprise Manager: a minimal OEM architecture, connecting DBs and middleware, collecting metrics, typical dashboards and alerts for operations.
Goal: quickly start monitoring DB and middleware without unnecessary overhead
When DBs and middleware don’t have unified monitoring, ops work "by symptoms." Users report "it's slow," integrations fail without clear cause, and on-call staff learn about issues from chats instead of alerts. There’s no single picture: where is the real bottleneck — host, database, connection pool, disks, backups, or FRA space?
Oracle Enterprise Manager (OEM) is needed not for pretty graphs but so that every day you can answer production’s basic questions:
- Availability: are hosts, DBs and middleware components alive; has the listener or managed server "fallen off"?
- Performance: are latencies, locks, queues, CPU, I/O, or connection counts increasing?
- Capacity: is there enough space on filesystems, tablespaces and FRA, are we limited by memory or disks?
- Backups: is RMAN running, is there a recent successful backup, are errors accumulating?
A realistic quick-start goal is to, within 1–2 days, deploy a minimal OEM architecture, connect several key targets (hosts, 1–3 DBs, one middleware environment) and enable typical alerts that catch ~80% of incidents. Then on-call becomes predictable: first the signal, then diagnosis, then actions.
This is not about fine-tuning thresholds per system or deep optimization. The focus is different: install, connect, start collecting basic metrics and build clear dashboards so monitoring brings value within the week.
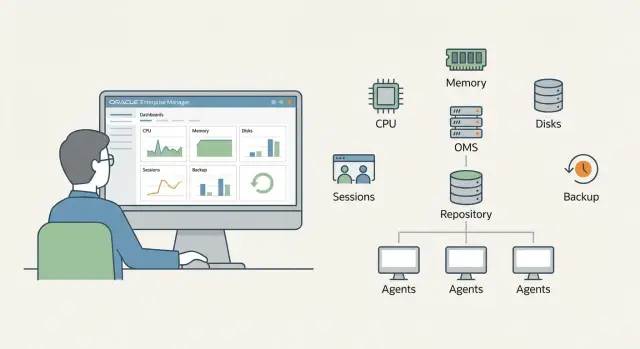
Minimal OEM architecture: what you need at first approximation
For a start it’s enough to understand three roles present even in the smallest installation.
OMS (Oracle Management Service) — the central server that receives telemetry and hosts the console. Management Repository — the database storing metrics, events, settings, alert history and reports. Agent (OEM Agent) — a service on each host with a DB or middleware: it collects metrics and sends them to OMS.
A typical minimal set is:
- 1 OMS
- 1 database for the Repository
- agents on hosts running Oracle Database and middleware
Everything else can wait for wave two, once the system runs and you understand the load: a second OMS for HA, a load balancer in front of OMS, a standby Repository, a separate reporting or integration server.
Where to place components
The most common start is a separate VM for OMS and a separate VM for the Repository. This makes maintenance, upgrades and bottleneck troubleshooting simpler. In very small infrastructures OMS and Repository are sometimes colocated, but as load grows you’ll hit disk and memory limits faster.
If you have critical environments (government, banking, healthcare), plan node separation and clear redundancy up front. In integration projects like those GSE.kz carries out, this approach typically reduces downtime and simplifies 24/7 support.
What matters most for stability
OEM often fails not because of CPU but because of storage or network latency. Check in advance:
- fast disks for the Repository (IOPS matter more than capacity)
- stable network between agents, OMS and Repository
- regular backups for the Repository and room for history growth
- redundancy: at least backups initially, later standby and a second OMS
This minimum gives a base: you connect targets, enable typical alerts and in the first week see real issues instead of noise.
Quick resource and placement estimate
OEM sizing usually comes down to how many targets you will monitor in the first 2–4 weeks. "Targets" typically mean hosts, Oracle Database instances, listeners, ASM, WebLogic domains and key middleware components. Count what you will monitor initially, not "the whole data center later."
What to count and where to locate
For a rough estimate list: number of hosts, DBs (prod and test separately) and middleware. If there are isolated network segments, check agent-to-management connectivity beforehand.
With few targets, one site (one VM or one server) for the management server and repository is sometimes enough at start. If growth is planned or HA is required, separate roles: OMS on one node, Repository on another.
Minimum acceptable and comfortable for start
| Component | Minimum (up to ~30–50 targets) | Comfortable (up to ~100–150 targets) |
|---|---|---|
| CPU | 4 vCPU | 8–12 vCPU |
| RAM | 16 GB | 32–64 GB |
| Disk for repository | 200–300 GB | 500 GB – 1 TB |
| Disk for logs/diagnostics | 50–100 GB | 150–300 GB |
Disk is more important than a flashy CPU: repository growth, metric history and diagnostics consume space quietly. A good rule: dedicate separate volumes at least for repository data and for logs so a log surge doesn’t "sink" the repository database.
Example: starting with 10 hosts, 12 DBs (prod+test) and 2 WebLogic domains, the comfortable configuration above usually lets you enable typical metrics and keep history without constant cleanup in the first month.
Installation and initial setup: a one‑day plan
To avoid a week-long rollout, prepare inputs in advance. Most time is spent not on the installer but on access, names and trust between hosts.
Before you start: prepare
You need a DNS name for OMS (with forward and reverse), accounts (root or sudo for agent install, a separate user for software), proxy parameters (if any) and a certificate plan. If the organisation enforces TLS, clarify whether an internal CA is acceptable or you need a preissued certificate.
Also decide on the DB for the repository (usually a separate Oracle Database). For a pilot one DB is OK, but allocate room for growth and backups.
Day plan (realistic)
- Prepare OS: packages, limits, time (NTP), firewall ports, disks for software and repository.
- Deploy or prepare the repository DB: parameters, tablespaces, accounts.
- Install OMS and create the repository, verify services start.
- Open the console, add the first host and install the agent, confirm metrics arrive.
- Enable basic operational settings: notifications and retention.
After installation do quick checks: can you open the console from a workstation, do main pages load quickly (if slow check DNS, certs or resources), and are timezone and time correct (otherwise graphs and alerts are confusing).
Enable email channel for notifications, working hours and maintenance windows, and a retention policy (so disks don’t fill). If OEM is deployed under government or financial sector requirements, coordinate with InfoSec early — this often saves a day on approvals (we encounter this regularly in GSE.kz projects).
Connecting targets: hosts, DBs and middleware
Most time is spent on the first target connections. The logic is simple: host first, then DB, then middleware. This way you immediately confirm the agent is alive and don’t search for errors in three places at once.
Start with the agent on the target host. After installation point it to OMS and register the agent. The host should appear in OEM as a Target and the agent status should be Up. If the host is not visible, common causes are DNS/hostname issues, ports or time synchronization.
Next add the Oracle Database. You will need credentials (usually SYSDBA or a dedicated monitoring user) and a reachable listener. After adding, check basics: OEM sees the instance, status is Open, ARCHIVELOG mode as expected, and metrics for sessions and tablespaces are collected.
For middleware (e.g., WebLogic) prepare credentials in advance. Minimum required usually is:
- WebLogic Admin account (or a user with config read rights)
- Admin Server address and port
- JVM parameters if access is restricted by proxy or firewall
- OS rights on the host if the agent will read logs and processes
After adding targets perform quick sanity checks:
- host is visible and updates without errors
- DB and WebLogic have fresh metrics
- Agent Last Upload is no older than 5–10 minutes
- no critical errors in Agent Status and OMS Alerts
If these pass, move to dashboards and typical alerts.
Metric collection: the minimum that actually helps
At start it’s better to collect a targeted set, not everything. Choose metrics that quickly answer three questions: is the system alive, where is the bottleneck, what changes over time.
In the first week focus on availability, load and I/O latencies. This covers most incidents impacting users.
Database: what to watch immediately
Start with metrics that usually give a clear picture:
- instance availability and response time (including wait latencies)
- active sessions and spikes in waits (locks, I/O, CPU)
- tablespaces (percent full and growth rate)
- archived logs and FRA (fill, generation rate, risk of halt due to lack of space)
- errors and critical events in the alert log (indicators something is wrong)
If users complain about "slowness" the combination Active Sessions + Top Waits + I/O latency often suffices to show whether it’s CPU, disks, locks or a query storm.
Host and middleware: the picture is incomplete without them
Minimum host metrics: CPU (including load average), memory, swap, filesystem usage, network errors and saturation. Often a problem looks like the database but is actually exhausted memory, swap usage, or a full filesystem for archive logs.
For middleware monitor metrics tied to service degradation: JVM heap and GC frequency, thread pool usage, datasource connection pool, and application error rates. A typical pattern: heap grows, GC becomes frequent, thread queue increases while the database looks "clean."
Collection frequency: avoid overload and misses
For key performance metrics collect every 1–5 minutes; for capacity (disks, tablespaces) every 5–15 minutes. For events and errors rely on threshold/event checks rather than extremely frequent polling. Start with moderate intervals and increase only where you need to capture short spikes.
Typical operational dashboards: 4 screens without overload
An operational dashboard should let you tell in 30 seconds whether things are OK and where to dig. Make 4 simple screens and keep them consistent across environments.
Principle: fewer widgets, clearer signals. Show 6–10 indicators per screen, set clear thresholds (yellow — warning, red — bad) and display last hour and 24‑hour views.
A set that typically covers 80% of shift questions:
- Duty screen: red targets, recent critical events, host and DB availability, job queue, agent upload status.
- DB performance screen: top waits, CPU load, Active Sessions, slow SQL, locks and long transactions.
- Capacity screen: tablespace growth, FRA usage, free filesystem space, 7–30 day trends.
- Middleware screen: JVM health (heap, GC), managed server status, connection pools and datasource metrics, frequent application errors.
To make dashboards actionable, add a short "what to check next" hint near each metric. For example, if Active Sessions rise, show top locks and top SQL nearby.
In integration projects (e.g., government or banking) this helps the duty engineer: they see the symptom and the engineer immediately knows where to check, saving time gathering data from different tools.
Starter alerts: what to enable right away
Enable alerts that catch outages and slow-building problems before they become incidents. Add other alerts later when you have statistics.
A basic useful set:
- Availability: Target Down, Agent Down, loss of data from a target
- Oracle Database capacity: tablespace nearing full, fast FRA growth, anomalous archive log generation
- Performance: CPU saturation, sudden DB Time growth, spike in active sessions
- Backups and jobs: no successful RMAN backup within a period, critical job failures
- Middleware: JVM heap near limit, datasource errors, stuck threads
Prefer soft thresholds to avoid alert storms on day one. Example: warn tablespace at 85% and critical at 95%. For FRA look at both percent used and growth rate — a fast fill should trigger alerts even at 70–80%.
Keep alerts useful by following simple rules:
- Start with critical alerts; add warnings gradually.
- Use a short delay (5–10 minutes) to filter transient spikes.
- Use different thresholds for prod and test.
- Group similar targets with templates to avoid per-target manual tuning.
- Test alerts live (create a situation) and tune thresholds.
A practical scenario: overnight archived logs grow fast, FRA fills and DB would stop on next write. With correct alerts you’ll get an early warning about archive log growth and FRA fill and have time to expand space or clean up before downtime.
For large environments (gov, finance, healthcare) this set gives maximum effect with minimal tuning and becomes the basis for further monitoring improvements.
Notifications and escalations: make alerts reach the right people
Monitoring is useless if alerts stay in the console. At start pick one reliable channel and a simple escalation scheme rather than trying to configure everything at once.
The most straightforward minimum is email. Configure a sender, verify delivery to external domains, and add a backup address (a shared on-call mailbox). Escalate by time: if an alert isn’t acknowledged in 10–15 minutes it goes to the next group.
Divide recipients by role:
- 24/7 duty (first level)
- DBAs (Oracle Database)
- middleware team (WebLogic and related)
- infrastructure (OS, network, storage)
Add spam protection: maintenance windows and suppression of repeats. A useful rule is "one alert — one mail" and send updates only on state change or severe worsening.
The message should help people act. Minimum contents that speed response:
- what failed: target and type (host, DB, middleware)
- how critical: severity and impact
- when it started: time and duration
- key metric and exceeded threshold
- what to check first: a short hint (listener, tablespace space, managed server health)
If FRA nears full at night, the duty engineer gets a clear mail, confirms the incident, and if no progress is made in 15 minutes OEM can automatically involve the DBA. This is faster and more reliable than manual forwards and calls.
Real-life example: one incident and how OEM speeds diagnosis
Night, 02:40. Duty receives a warning: FRA usage is rapidly increasing. Minutes later another alert: archived redo logs are being generated faster than normal. A third signal shows the nightly backup did not complete. Without monitoring this often looks like "disk ran out," but OEM collects the chain into one clear event.
First the FRA usage alert fires (e.g., 85% warning, 95% critical). Then you see increased archived redo log generation (more frequent log switches). In parallel the RMAN Job status shows the backup failed or hung, so archived logs aren’t being deleted per retention. In 10–15 minutes the DB is close to stopping due to lack of space.
The duty opens two screens: the DB summary (state, load, errors) and storage/FRA. The FRA chart shows a sharp sawtooth fill and Job Activity shows the last failed backup and error code. This quickly confirms root cause: not a sudden data surge but archive logs accumulating because the backup didn’t complete.
Typical actions: short-term — free space (expand FRA or filesystem, move some archived logs to temporary storage, restart the failed RMAN job). Long-term fix — resolve backup failure (access to backup repository, channel limits, channel errors), add an alert for "RMAN job failed" and a forecast alert "FRA projected full in N hours" so you’re warned earlier than at 95%.
This scenario shows the value of launching OEM with a minimal metric and alert set: duty sees not only the symptom but a clear sequence of causes.
Common mistakes when deploying OEM and how to avoid them
Disappointment usually comes not from OEM itself but from "try-to-cover-everything" settings. First get clear signals, then broaden coverage.
Mistake 1 — thresholds that are too low. If alerts fire on every short CPU spike or a couple slow queries, the team quickly ignores them. Start with thresholds that catch downtime risk: full filesystems, FRA and tablespaces, listener unavailability, queue growth, backup errors. Add sensitive rules after a week of observation.
Mistake 2 — enable all metrics and collections at once. This overloads OMS and the repository and creates noise. Better to enable a minimum and make one clear dashboard than to collect everything and watch nothing.
Mistake 3 — one set of credentials for everything and no roles. It becomes hard to delegate safely: DBAs, middleware admins and support interfere with one another. Separate access per target and create named credentials for prod/test and different tasks.
Mistake 4 — underestimate repository growth. Data accumulates quickly and space runs out unexpectedly. Define retention policy, monitor growth and leave disk buffer.
Mistake 5 — mismatched time on hosts. Result: "jumping" graphs and alerts without logic. Quick prestart checks:
- time sync on OMS, Repository and targets
- correct timezones
- uniform NTP settings
- verify network latency to agents
- test notifications on a pilot group
Short checklist: monitoring readiness for operation
Before declaring "monitoring live" do a short verification so OEM does not become a nice showcase.
First check data quality. If agents drop periodically everything else is meaningless. A start guideline: freshness of key targets (host, DB, middleware) should be within 10–15 minutes and no "Unknown" targets.
What should be ready for first operation:
- all agents and targets show Up, collection delay within chosen threshold (e.g., under 15 minutes)
- one "duty screen" and roughly 10–15 alerts you are ready to handle
- backup jobs visible and notifications set for any backup error or missed schedule
- targets grouped clearly (by service or environment) and basic access roles enabled
- a simple growth plan: when N more DBs/servers are added, what to scale in OMS and repository (CPU, memory, disk, maintenance)
If you can answer "yes" to each item without caveats, OEM is helping rather than just installed. Next step is usually: after 1–2 weeks remove noisy alerts and fine-tune thresholds to your load.
Next steps after the quick start
After initial metrics and alerts don’t stay on default settings too long. In the first weeks OEM reveals the real picture and thresholds should be adjusted for backups, nightly jobs and middleware behaviour.
30-day plan
A short plan to turn monitoring from a screen into a working tool:
- adjust thresholds: separate expected peaks from real problems
- add capacity planning: trends for CPU, memory, disks, data growth and archive logs
- configure regular reports: weekly for ops and monthly for managers
- analyse top-10 events for the week and remove noise, keeping the important alerts
- ensure each alert has a clear owner and first action
If monitoring runs on a minimal architecture (everything on one server), consider role separation when targets grow, collection frequency increases, heavy reports appear or 24/7 availability becomes critical. A good sign: maintaining OEM itself becomes awkward and harms observability.
How to integrate OEM with operations
Agree simple rules: which alerts require shift response, which can be closed by runbook, and how to record postmortems (what happened, how it was found, how to prevent it). Then OEM becomes part of the process, not a separate system.
If you prefer to start with a pilot and concurrently refine hardware and deployment, this can be done together with GSE.kz as a systems integrator — especially when you need to account for support and growth requirements right away.
FAQ
What is the minimal monitoring goal for the first 1–2 days of OEM deployment?
For a quick start it is enough that monitoring reliably answers four questions: availability of hosts/DB/middleware, basic performance, capacity (disks, tablespaces, FRA) and RMAN backups. If these are under control, you cover most typical incidents without lengthy tuning.
What components make up the minimal OEM architecture?
The minimal setup has three roles: OMS as the central server and console, a database for the Management Repository to store metrics and events, and an OEM Agent on every host that runs Oracle Database or middleware. With this set you can immediately connect targets and enable typical alerts.
Where is it better to place OMS and the Repository: together or separately?
The most practical option at the start is to place OMS and the Repository on separate VMs or servers so it’s easier to operate and so repository disk load won’t “sink” the console. Installing everything on one node only makes sense for a very small number of targets and with the expectation of scaling soon.
What most often makes OEM unstable and what should be checked in advance?
Problems usually begin with slow repository storage and unstable network between agents, OMS and the Repository. Check IOPS for repository disks, DNS and reverse DNS, time sync (NTP) and spare disk space for history and logs before you start.
How to estimate OEM resources for the start and what does the size depend on?
Sizing depends on how many targets you will monitor in the next 2–4 weeks: hosts, DB instances, listeners/ASM, WebLogic domains and key middleware components. For an initial scope of a few dozen targets, 4 vCPU and 16 GB RAM for OMS/management node may be enough, but comfort usually comes from extra RAM and—most importantly—disk space for the Repository.
In what order should targets be added: host, database or middleware?
Install the agent and make sure the host appears as a Target with status Up and recent data. Then add the Oracle Database (check listener availability and credentials) and only after that add middleware. This way you avoid hunting for the same issue across network, agent and application access at once.
Which Oracle Database metrics should be enabled in the first week?
Start with availability and a few "signal" metrics: Active Sessions and top waits, I/O latency, growth of tablespaces, FRA fill level and rate, and errors in the alert log. This is usually enough to quickly determine whether the cause is CPU, disks, locks or abnormal query load.
What basic host and WebLogic metrics are needed to get the full picture?
For a host, at minimum monitor CPU and load average, memory and swap, filesystem fill levels and basic network errors. For middleware, the most useful metrics are JVM heap and GC frequency, managed server status, connection pool metrics and signs of stuck threads, because service degradation often starts in the JVM rather than the database.
Which typical alerts should be enabled immediately and how to avoid drowning in noise?
Enable alerts that warn about outages and cumulative problems: Target/Agent Down, filesystem/tablespace/FRA near full, missing successful RMAN backup, sudden DB Time increase or active sessions spike, and for middleware — heap or datasource problems. Set soft thresholds and a 5–10 minute delay to avoid a flood of notifications.
How to configure notifications and escalation so alerts actually reach the right people?
Start with one reliable channel (usually email), configure working hours and maintenance windows, and a simple time-based escalation if an alert is not acknowledged. The notification should tell what failed, when it started, which metric crossed the threshold and what to check first, otherwise the message won't speed up response.