PC operational metrics: how to spot build issues
Operational PC metrics help detect build issues early: temperatures, throttling, fans, power and SMART. Thresholds and quick checks.
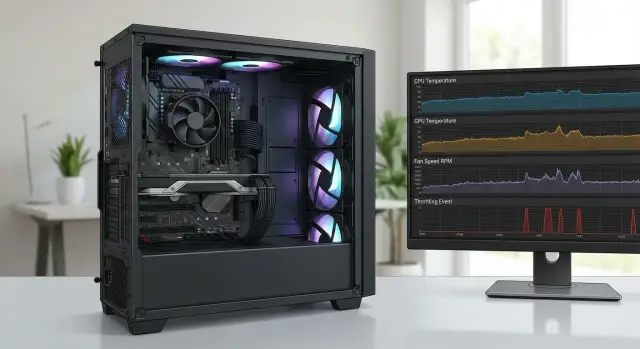
What build issues show up in operational metrics
Build quality in real use is not just tidy cables and “the right” components on paper. It’s how a PC behaves under load every day: does it hold stable clocks, does it overheat, lose power, or reboot unexpectedly.
Operational metrics often reveal problems before a clear failure occurs. A poorly seated cooler or dried thermal paste first looks like rising temperatures and occasional throttling, and later becomes noticeable slowdowns and freezes.
The monitoring view most commonly highlights these assembly mistakes:
- Cooling-related overheating: temperatures rise faster than normal and stay too high under load (early sign — sustained 85–90°C on CPU or GPU in typical tasks).
- Throttling and frequency drops: clocks fall for no obvious reason, and performance noticeably fluctuates between runs.
- Fan issues and wrong curves: RPMs stick at one level, a fan occasionally stops, or you see sudden RPM jumps.
- Power instability: sudden reboots, WHEA errors, freezes when a load starts, or black screens.
- Storage errors: rising SMART warning counters, pauses during reads, speed drops after warming up.
Users usually notice symptoms, not numbers: the PC gets louder, stutters in usual apps, or occasionally freezes or reboots. Metrics help link those symptoms to causes instead of guessing.
There is no single threshold that fits all: much depends on CPU/GPU model, case, room temperature and workload profile. But early signals are almost always the same: temps rise relative to your norm, frequency drops repeat, and values that used to be steady start jumping (RPM, voltages, errors).
Which metrics to collect and how often
You don’t need to turn a PC into a lab to catch a weak point in the build. Regularly check a few clear indicators and compare them to past behavior.
A minimal set worth noting (at least in notes): CPU and GPU temperatures (plus GPU hotspot if available), SSD temperature, clock speeds and power limits (if shown), CPU/GPU load and memory, fan RPMs, and any errors or crashes (reboots, WHEA, freezes, device dropouts).
How often you chart these depends on how critical the machine is and how often conditions change (dust, heat, moves, updates). A practical schedule is:
- basic check after purchase/build and after driver installs;
- daily background watch for red flags only (overheat, throttling, 0 RPM on a fan under load);
- weekly review — compare temps and clocks in the same tasks;
- ad-hoc check after any change (cleaning, moving, reapplying thermal paste, upgrades).
Record context too: room temperature, the workload scenario, whether the case is closed and when filters were last cleaned.
Often comparison matters more than absolute numbers. If the CPU or GPU runs 10–15°C hotter under the same workload and fans spin faster, act: check dust, cooler contact, fan curves and airflow.
CPU and GPU temperatures: guides and early thresholds
Temperatures are one of the quickest ways to spot cooling or assembly issues. Look at stable values over 10–15 minutes of a typical load and compare to how the PC behaved before.
A warning for CPUs is when, in typical tasks (office, browser, video calls, light work), it consistently stays above 85–90°C. A second-long spike can be normal, but if the temperature remains high, investigate. The same logic applies to GPUs: if a GPU holds 80–85°C or higher under usual loads and used to be noticeably cooler, it’s usually a cooling or configuration problem.
Check idle too. If CPU or GPU idles at 50–60°C+ in normal room conditions, it often means poor case airflow, dust, wrong fan curves, or poor cooler contact.
Another early sign: temperature climbs within 1–3 minutes even under modest load (a few tabs, a video call, a build, an export). That jump is typical of poor cooler contact, dried thermal paste, or trapped hot air in the case.
Simple early-response thresholds:
- idle consistently above 55–60°C (CPU or GPU) — check dust, airflow and fan settings;
- CPU holding above 85–90°C for over 10 minutes in normal workloads — check cooler mount and thermal paste;
- GPU in regular tasks at 80–85°C+ — check intake air and case fans;
- temperatures rising too fast under light load — look for poor cooler contact;
- “it was cooler before, now hotter” without changed workloads — almost always degraded cooling, not a spontaneous failure.
Example: a workstation used to sit at 65–70°C in video calls but suddenly jumps to 90°C. The cause was a clogged filter and a slightly loose cooler mount after transport.
Throttling: how to tell heat from power issues
Throttling is when the CPU or GPU reduces clock speeds (and often voltage) while the workload continues. In metrics it looks like a saw: clocks and performance dip, then recover, repeatedly.
React when you see regular 10–20% frequency drops under stable load in the same test or task. If it repeats, it’s usually not purely software but cooling, limit settings, or power.
How to distinguish thermal vs power throttling
Thermal throttling almost always coincides with temperature hitting the upper bound. Practical rule: if CPU is around 90–95°C or GPU around 83–87°C when clocks fall, it’s likely thermal. Power-related throttling looks different: temperatures are normal (roughly 60–75°C) but clocks dip and you see brief performance drops, sometimes with a power limit hit.
What to check first
A short checklist is usually enough:
- cooler mounting and thermal paste (common cause: uneven or loose contact);
- case airflow (filters, fan directions, blocked vents);
- power limits (PL1/PL2 for CPUs, power limit for GPUs) — are they set too low;
- PSU and power cables to GPU/CPU — adequate wattage and secure contacts;
- correlate logs of clocks, temps and power at the same moments (the trio matters, not a single number).
Example: an office PC running 100% CPU for render holds 70°C, but every 20–30 seconds frequency drops by 15% and then returns. That usually points to a power limit or PSU-related limit rather than overheating.
Fans and pump: failure signals and wrong setup
Fan readings often show that cooling isn’t working as it should. Worrying signs are not only high temps but how the system tries to control them.
Clear red flags:
- RPM periodically drops to 0 or jumps every few seconds;
- fans run at 80–100% constantly during light tasks while they used to be quiet;
- mismatch: CPU/GPU at 85–95°C while fans remain at low RPM.
These mismatches can be caused by wrong sensor used in the fan curve, misplugged headers, a tachometer fault, or a physical problem: fan stuck, touching a cable, or worn out.
For AIO/water loops, a separate case: temps rise, radiator fans speed up but there’s little effect. Frequent causes are pump issues (low RPM, stops), air in the loop, or incorrect power/connection.
Local checks are simple: ensure the fan blades spin freely and don’t hit cables, check mounts and dust, listen for grinding or squeal, and verify which sensor the curve uses. Pump RPM should be steady, without drops or 0 RPM.
Power and stability: reboots, errors and drops
Power problems often hide as "Windows glitches," but they’re catchable by repetition. The key sign: failures happen at the same moment — when a heavy task starts or load spikes.
Sudden reboots without blue screens, freezes under load, or app crashes when load peaks (video export, compilation, report generation, simultaneous CPU+GPU stress) are worrying. Practical threshold: 2 or more such incidents in 7–10 days tied to heavy work — this likely isn’t random.
A secondary sign is slower run time under combined CPU+GPU load by 10–15% when temperatures are normal and there’s no clear throttling. That often points to power: the PSU can’t hold peaks, a connector has poor contact, or a protection is tripping.
Common causes are underpowered or aging PSUs, poor-quality cables, loose power connectors (24-pin, 8-pin CPU, GPU power), or cable bends at connectors.
Quick checks without deep troubleshooting: fully seat power connectors until they click, remove cable tension and sharp bends, inspect contacts for dirt or corrosion, try another mains cable and outlet to rule out external issues. Most importantly, log what triggers the failure — a repeatable trigger matters more than a single error.
Drives and SMART: catching degradation early
SMART can reveal drive deterioration before data loss. If you already collect operational metrics, add SMART and drive temperature — this often signals an assembly issue, not only aging hardware.
For SSDs, watch not only "bad sectors" but errors and stability drops: pauses during writes, sharp copy speed drops, increased response times (notably during updates/installs). In SMART, watch Media and Data Integrity Errors, Available Spare, Percentage Used and Unsafe Shutdown counters.
For HDDs, direct markers are Reallocated Sector Count and Current Pending Sector. Pending sectors mean the drive may still work, but risk rises quickly. Also monitor Read Error Rate/Seek Error Rate over time, not just single values.
Early thresholds to react immediately:
- HDD: Current Pending Sector > 0 or Reallocated Sector Count rising week to week;
- SSD: Media/Data Integrity Errors > 0 or Available Spare falling below 10%;
- any drive: rising UDMA CRC Error Count (often indicates cable/connection problem rather than the drive);
- temperature: SSD regularly above 70°C, HDD above 55°C;
- behavior: OS boot and opening usual files slowing down for several weeks.
Assembly problems are common causes: a drive not fixed well (vibration), a bay without airflow, a drive placed next to a hot GPU, or a loose SATA cable. Example: an office PC’s HDD rattled in a loose cage, SMART showed rising CRC errors and copy pauses despite no reallocated sectors yet. Fixing mounts and replacing the cable prevented damage.
Noise, vibrations and dust: simple signs of build issues
Noise and vibration often appear before logs show errors. Treat them as everyday "metrics": changes compared to how the PC sounded or felt a week or month ago under the same tasks.
Noise as a metric: what to worry about
The important signal is not just “louder” but “different.” If a new hum, rattle or high-pitched whine appears under load, check mounts and airflow. Be suspicious if the noise appears suddenly and repeats with the same workload; if fans now reach high RPM 20–30% more often; or if sound changes when lightly pressing the case or removing a side panel (resonance, loose screws).
Common causes are worn fans, a cable caught in blades, loosely mounted coolers, or misaligned panels.
Vibration and dust: trend matters more than a single reading
Vibrations that grow over time often mean an unbalanced fan or a loosely mounted drive/case part. If vibration becomes noticeable in 2–4 weeks and transmits to the desk, don’t delay — imbalance accelerates wear.
Dust acts like "slow throttling": in dusty environments, temperatures and RPMs usually rise after 2–3 months. A practical rule: if temperatures after cleaning (heatsinks, filters, vents) don’t return within 5–10°C of previous baseline under the same load, suspect cooler mounting or thermal interface issues rather than dust alone.
Real-life example: metrics leading to a specific cause
An office PC ran quietly for a year but then began to get loud and slow on the same tasks: multiple browser tabs, video calls, Excel. The user said the fan often howled and the system sometimes stuttered for 10–20 seconds.
The first metric check was CPU temperature. Where it used to be 55–60°C during office work, it rose to 70–75°C — about a 15°C jump with no change in workload. The CPU fan stayed at 90–100% and frequently oscillated, while logs showed short frequency drops.
Quick local diagnostics
They started with easy checks: inspect dust on the heatsink and filters, ensure intake isn’t blocked, verify no cables touch fan blades or block flow, confirm the cooler is tight and not wobbling, and compare fan profiles.
The cause was typical: a dusty heatsink and a slightly loosened cooler after transport. They also found a cable partially blocking the rear exhaust.
Fix: clean, reapply thermal paste, tighten the cooler, secure cables and restore airflow.
After service, they compared before/after under the same tasks: temperatures returned to previous levels, the fan stopped pegging at 100%, and frequency drops disappeared. If metrics climb again after maintenance, next steps are to check the fan itself, cooler contact quality, power and BIOS settings.
Short checklist for early response
If you check operational PC metrics at least weekly (and after any service), assembly problems are often visible before many users complain. Compare idle and typical load: both absolute numbers and trends matter.
Usually you want 2–3 matching signs:
- Temperatures: idle CPU often around 35–55°C, GPU 35–60°C (adjust for case and room). For prolonged load, be cautious: CPU 85°C+ (critical 95°C+), GPU 83–85°C+ (critical 90°C+). Fast jumps of 15–20°C during the same task point to poor cooler contact, thermal paste or airflow.
- Clocks and throttling: if clocks regularly drop by 10–15%+ under the same task and load and temperatures are high, it looks like thermal throttling. If temperatures are normal and clocks dip, suspect power limits, PSU, BIOS or power connectors.
- Fans and pump: suspect problems if you see 0 RPM where a fan should spin under load, or if RPMs oscillate (e.g., 500–800 RPM back and forth every few seconds). Constant 100% without heavy load signals a curve or heat transfer issue.
- Stability under load: reboots, freezes and bluescreens during render, gaming, or builds often point to power, VRM overheating, or loose cables.
- Drives and SMART: act quickly if SMART errors grow (e.g., reallocated/pending sectors > 0 and increasing), interface errors appear, NVMe temps stay at 70°C+ or speeds drop 30%+ without workload changes.
Mini rule: log any new deviation as "before/after" and check repeatability. If a symptom repeats three times under identical conditions, it’s likely not random.
Common mistakes when interpreting metrics
Metrics are useful only in context. The same number can be normal during a render and worrying at idle, so view the whole picture.
Common errors:
- looking only at temperature and ignoring load, clocks and fan RPMs. 85°C at 100% load can be acceptable, but 85°C at 20% load suggests poor airflow or cooler contact.
- comparing different PCs directly. Case, filters, fan count, paste, room temperature and placement change the picture more than you think.
- getting used to rising noise. If fans hit high RPM more often, it’s not just ageing — check curves, dust and causes of rising temps.
- treating throttling with cleaning only. If throttling returns after cleaning, check cooler mount, thermal paste, pump operation (for AIO) and power.
- changing settings randomly and not recording changes. That easily makes things worse and you won’t know what fixed the issue.
Change one parameter at a time and record results. If monitoring shows 95°C spikes and fans don’t ramp at those moments, it’s often a fan curve or sensor issue. If fans go to full speed but temps still climb, cooler contact or thermal paste is the likely cause.
Next steps: order of actions and prevention
If metrics hint at assembly problems, act calmly and methodically. First you need a baseline — typical values for your PC at idle and under load. Without that you can’t distinguish normal from faulty.
Order of actions when metrics worsen
First record the symptom: what workload, how many minutes until appearance, and which metrics change (temp, clocks, RPM). Then:
- compare to baseline (a +10–15°C rise is reason to investigate immediately);
- check if throttling occurs and when it starts;
- evaluate fans/pump (RPM jumps, 0 RPM, stoppages);
- find repeatable failures: reboots, freezes or errors under similar conditions;
- after changes (cleaning, tightening mounts, reapplying thermal paste) re-measure and compare to baseline.
Change only one factor between measurements so you know what fixed the issue.
Prevention to avoid catching failures mid-crisis
Keep the plan simple:
- every 1–3 months: visual dust check and verify fans spin steadily;
- every 6–12 months: cleaning, checking cooler/radiator mounts and power cables;
- after moving or a shock: check contacts (RAM, GPU power) and rerun a load test.
For critical machines, keep spare components (fan, PSU, SSD) and plan maintenance. In organizations this is often easier when procurement and support come from a single vendor and integrator. For example, GSE.kz (gse.kz) produces PCs and servers in Kazakhstan and provides system integration and support, which is convenient when unified standards and predictable fleet maintenance matter.
FAQ
Where do I start monitoring if I never checked metrics before?
Start by capturing a baseline: record temperatures and clock speeds at idle and during your typical task for 10–15 minutes at normal room temperature. Then watch trends: if the same tasks run consistently 10–15°C hotter than your baseline, check cooling and airflow even if the numbers are technically within limits.
What CPU temperature is really a problem, not normal?
Short spikes of a second are usually fine, especially during brief load bursts. It’s more worrying when a high temperature holds for a long time. For typical tasks, sustained CPU temperatures of 85–90°C for more than 10 minutes are a sign to investigate; 95°C and above is a reason to stop the load and check cooling.
Why did idle temperature suddenly become 55–60°C or higher?
If idle temperatures rise to 55–60°C or higher in normal room conditions, it usually points to airflow or settings rather than "hot hardware." Check dust on filters and heatsinks, fan directions, and whether fan curves are stuck at low RPM.
How to tell if throttling is due to heat or power?
Look at the pair “temperature + frequency.” If clocks drop when temperature reaches the upper limit (for example, CPU around 90–95°C), it’s likely thermal throttling. If temperatures are moderate (roughly 60–75°C) but clocks and performance intermittently drop, the cause is more often power limits, PSU issues or BIOS/power settings.
What indicates fans are misconfigured or failing?
Bad signs are mismatches: high temperatures while fans don’t ramp up, or conversely fans at 90–100% during light tasks. Sudden RPM jumps or periodic 0 RPM readings where the fan should be running, wrong sensor mapping, wrong header connection, or worn bearings are also red flags.
Which metrics point to a problem with AIO/water cooling (pump/air)?
If radiator fans speed up but temperatures keep rising, check the pump or air in the loop. The pump should show stable RPM without drops to 0. Rapid temperature rise within 1–3 minutes under a modest load is a reason to verify pump power and connections and for air in the loop.
How to tell by symptoms if it’s a power issue, not Windows?
Unexpected reboots without a blue screen or a black screen when a heavy task starts are suspicious. If that repeats 2 or more times within 7–10 days under similar load, first check power connectors are fully seated, remove cable stress and sharp bends, inspect for dirt on contacts, and only then consider the PSU.
Which SMART metrics usually indicate a build/assembly issue (cable/airflow) rather than drive aging?
An increasing UDMA CRC Error Count usually points to cable or connection faults rather than a dying disk. SSDs running regularly above 70°C and showing speed drops after warming up typically need better cooling or different placement. For HDDs, pending or reallocated sectors are direct hardware warnings.
Should I check metrics after cleaning or moving the PC?
After any hardware change, quickly re-capture your baseline metrics in the same conditions. After transport, cooler mounting can shift, power connectors can loosen, or cable routing can change — all of which often show up immediately as higher temps, more noise, or throttling.
How to fix issues by metrics without getting confused or making things worse?
Change only one thing at a time. Use a reproducible scenario (same task for 10–15 minutes), record metrics, then change one factor: dust cleaning and filters, cooler mounting and thermal paste, fan curves, cable routing and airflow. After each step, compare before/after.