OpenTelemetry in an organization: a unified pipeline for metrics, logs and traces
OpenTelemetry helps collect metrics, logs and traces into a single observability pipeline. We cover architecture, rollout steps, common mistakes and a checklist.
Common pains without a unified observability pipeline
When metrics, logs and traces live in different places, the team only sees parts of the picture. Metrics show that something degraded. Logs provide thousands of lines without context. Traces are missing or not linked to errors. Even a simple incident turns into a long search for the failing service, while the business suffers downtime and unhappy users.
People usually start talking about OpenTelemetry after repeated incidents: users complain about slowdowns, SLAs slip, and it’s hard to prove the root cause. Disparate tools add noise: each has its own format, field names and rules. The same request can be named differently in dashboards and logs, and teams argue about the data instead of the cause.
Typical issues are: it’s hard to quickly determine where the problem is (app, database, network or external provider); the business impact in money and time is unclear; there are many alerts but they don’t answer “what to do right now.” After a fix it’s hard to confirm improvement, and responsibility easily gets shifted between teams because there’s no single source of truth.
The benefit of a unified pipeline isn’t “pretty graphs” but measurable results: lower MTTR, fewer recurring incidents, transparent SLA reports for the business, and clear priorities on what to fix first and why.
A simple example: payments go through overall, but some users see an error at confirmation. Without linked signals the team spends hours checking versions. With a unified pipeline you see increased latency in a specific service, matching error logs by the same request_id and a trace showing where the request got stuck.
The three signals: metrics, logs, traces in plain terms
Metrics answer “how well or poorly things are behaving.” They are numbers over time: load, latency, error rate, queue fill. They quickly show that something went wrong and are good for alerts.
Logs answer “what exactly happened.” They are events: an error message, a warning, the fact that a step was executed. Logs give detail but without structure they’re hard to search, especially when events are many.
Traces answer “where time was lost or where it broke.” They show the path of a single request through services and databases and break it into steps. Traces are especially useful if you have microservices or many external dependencies.
Sometimes metrics are “quiet”: average latency looks normal, but some users report freezes. A mean smooths peaks; a trace can show that 5% of requests wait on the same DB table due to locks. Conversely, traces might be enabled but heavy and incomplete; then queue and timeout metrics quickly show that the problem started right after a release.
The link between signals is context. Think of it this way: every request gets a trace_id. It appears in traces and logs and sometimes as labels on metrics. From an error chart you then jump to logs for the relevant requests, not every log. At that point OpenTelemetry stops being “three sources” and becomes a single investigation path.
On day one don’t try to collect everything. Extra data almost always gets in the way: continuous DEBUG logs, full request/response payloads (especially with personal data), high-cardinality metric labels (like user_id or order_id), 100% tracing without sampling, and duplicate metrics without a clear purpose.
Start with a few key metrics (errors, latency, load), structured logs for important events and traces for critical user flows.
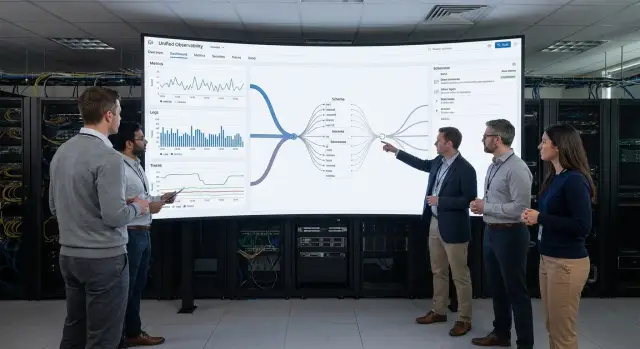
What a company’s OpenTelemetry pipeline consists of
The OpenTelemetry pipeline is the chain that carries metrics, logs and traces from the application to storage, dashboards and alerts. The clearer the chain, the fewer surprises after launch.
Typically the pipeline includes:
- instrumentation in the app: OpenTelemetry SDK (manual) and/or auto-instrumentation via an agent
- OpenTelemetry Collector: receives data, cleans, enriches, filters and forwards it
- exporters and delivery protocols: so data goes to chosen storages uniformly
- storages: separate systems for metrics, logs and traces or a single platform if it supports all
- visualization and alerts: dashboards, log search, trace viewer, notifications
The Collector often becomes the central hub. Its advantage is the ability to change storages and processing rules without redeploying all applications. For example, you can add masking of sensitive fields in logs or reduce trace detail without touching services.
One collector or many is a question of scale and risk. One is simpler for a start and fits small teams. Multiple collectors are needed when you require redundancy and separation zones: different clusters, sites, security requirements. A common compromise is local collectors near services plus a central one that receives normalized data.
Placement affects quality. A collector near the application reduces latency and handles network issues better. In-cluster collectors are easier to manage. Hosting in a data center or separate site makes it easier to control access and egress, which matters for government and large organizations.
To ensure signals match, set minimal naming standards before broadening coverage. A small set that saves hours: a unified service.name, clear environment (prod/test), service.version for releases and stable host or instance identifiers. Then a metric, log and trace will truly refer to the same thing.
Preparation: decisions to make before installing the first agent
Most failures start not in code, but because the team didn’t agree on goals and rules. Before installing the first agent and enabling OpenTelemetry, spend a couple of hours on basic decisions. This saves weeks of arguments and noisy alerts.
First, choose a pilot. Don’t take the whole system at once or you’ll drown in data and won’t know what improved. A good pilot is 2–3 services that directly affect users: login, search, form submission, payment. For infrastructure observability in a government or clinic context, start with the area that most often “freezes” reception or record keeping.
Next, define what you want to protect: not “everything works” but specific user expectations. Usually 2–3 scenarios and simple measurable indicators (SLIs) are enough.
Example scenarios: “user opens dashboard and sees the main page,” “operator saves a patient record,” “cashier completes a payment.” For each, decide in advance what counts as success: share of successful requests, 95th percentile response time, number of specific error types.
To prevent data from becoming a liability, agree rules before starting: what counts as personal data (PII) and must not be logged in traces or attributes, retention periods for raw logs and traces versus aggregated metrics, who gets access by role, boundary between prod and test and how to avoid mixing data.
Assign owners. Someone (or two people) must own dashboards and metric meaning, and someone must own alerts and response rules. Without owners, in a month you’ll have pretty graphs nobody trusts.
Step-by-step: how to launch OpenTelemetry without chaos
Launch via a pilot, not “everywhere at once.” The goal for the first two weeks is trusted basic telemetry, not a perfect picture.
Start with minimal metric coverage. Choose 2–3 key services and collect infrastructure metrics (CPU, memory, disk, network) and application metrics (response time, request count, error rate). Keep granularity moderate to avoid hundreds of graphs and storage costs.
Then normalize logs so they are quickly comparable. If some logs are free text and others JSON and levels are inconsistent, searching becomes guessing. Agree on a format and mandatory fields (service, environment, level, request, user or user type) and verify filters work consistently across teams.
Enable traces selectively. Pick 1–2 critical routes like “user login” or “submit form” and add tracing only there. The payoff is quick: you see whether time goes to the DB, an external service or queues.
Add correlation so signals link: trace_id must appear in logs, and a trace should clarify which service and metrics the issue relates to. Then the path “metric alert → log → trace” takes minutes.
Simple rules help on day one: one pipeline owner and one change channel, consistent service and environment names (prod, stage), limits on metric cardinality (no user_id in labels), pilot in a single domain, then expand.
At the end of the pilot create one shared dashboard and a few alerts that actually wake someone: rise in 5xx above threshold, p95 latency above norm, spike in DB connection errors. Expand coverage afterward; otherwise observability becomes noise.
Data normalization: make metrics and logs comparable
Without normalization you quickly end up with “three separate worlds”: metrics alone, logs alone, traces alone. Finding the root cause becomes guesswork even if OpenTelemetry collects something.
Start with structured logs. “Something broke” text is useful for humans but systems need fields: level, error code, duration, operation name, request context. If you log durations, use a single field name and units (for example, milliseconds), otherwise comparison with metrics will be misleading.
A key practice is unified resource and attribute names. Agree a minimal set present in every signal: service.name, environment, region, version. Then a filter like “only prod in region KZ, version 1.8.3” works the same for metrics, logs and traces.
Correlation helps investigations. request_id should follow the request path and appear in logs and spans. If your platform supports trace_id in logs, add it so a log error opens the trace immediately.
Typical attributes that pay off in the first weeks: service.name and service.instance.id, environment (dev, stage, prod), region or dc, version, request_id (and trace_id when possible).
Keep volumes under control. In prod raise log levels only selectively and for limited time, set caps on event size, use sampling for traces and log detail but not for critical errors. Add user_id only if policy and law allow, preferably as a pseudonym or hash.
Common mistakes that break observability value
Observability paradox: tools are in place, data flows, and teams still answer “where is the problem?” slowly. Usually the issue isn’t OpenTelemetry itself but how it was enabled.
1) Lots of data, little meaning
Collecting everything (every metric, all logs, 100% traces) increases costs, fills storage, and makes dashboards heavy. The team stops looking at monitoring. Start with a minimal set: key SLIs, important logs and sampled traces, then expand.
2) No common naming and environments
If the same service is called billing-api, BillingService and billing across teams, comparing graphs and spotting regressions becomes nearly impossible. Same for environments: prod, production and live become three worlds. Fix naming and environment tags before scaling.
3) Alerts react to noise, not to users
A common mistake is alerting on internal metrics without linking to user impact. For example, a CPU spike alert when user latency and errors haven’t changed. Build alerts around availability, p95 latency and error rates, and add context: which service, region, scenario.
4) Traces exist but investigations are still slow
If traces aren’t linked to logs and metrics you see call chains but not the “why.” Minimum everywhere: trace_id in logs and consistent service attributes. Then searching by one identifier assembles the full picture.
5) Enabled in prod without load testing
Telemetry consumes resources. If sampling, limits and export paths aren’t tested, you can see increased latency or unexpected GC pauses. This is noticeable in heavily loaded systems, e.g., enterprise services on data center servers.
If OpenTelemetry is rolled out together with infrastructure integration (for example, by a systems integrator), agree data rules and detail levels in advance. Then a unified pipeline speeds diagnosis instead of adding noise.
Access, security and storage: important boundaries
When OpenTelemetry gathers signals in one place, a common mistake is opening everything to everyone. Data quickly becomes sensitive: logs may contain personal data, traces can include request parameters, and metrics show usage and behavior.
Separate access by roles and tasks. Different people view an incident but don’t need the same details.
- Development: read traces and logs for their service, access to release dashboards, no admin rights
- Operations (SRE/ops): access to infra metrics, alerts, rule settings, limited access to business logs
- InfoSec/compliance: audit actions, access to raw security logs, manage masking policies
- System owners: aggregated reports and key metrics without raw events
Protect sensitive data at collection time, not by manual cleanup later. Practical minimum: block collection of certain fields (password, token, card), mask values by patterns (email, national ID, document numbers) and decide whether to store request and response bodies. If the goal is latency analysis, route, status_code and duration are often enough.
Separate retention by data type. Metrics are valuable longer because they’re aggregates (for example, 13 months for seasonality comparisons). Logs are costlier and riskier, so retention is often shorter (for example, 7–30 days in hot storage and up to 90 days archived). Traces are usually kept shortest (for example, 3–14 days) with the option to save samples for major incident investigations.
To prepare for audits, record in advance: who changed access and masking policies and when, which fields are collected and which are blocked, retention and deletion rules, where keys are stored and who has access, and a log of admin actions and data exports.
Example scenario: how a unified pipeline finds the cause
Users contact support: “Payment hangs” or “Booking spins and doesn’t confirm.” From outside it’s one complaint, but inside there can be many causes — from the database to an external provider.
The team starts not with guesses but with one metric: response time for the key operation (for example, /pay or /appointments/confirm). The chart shows latency rising only for a subset of requests and only during business hours. That’s more useful than dozens of chat messages.
Next they enable tracing. By trace_id they see which step consumes time: API entry, user check, payment gateway call, DB write, or queueing. With a unified pipeline, moving from a metric to a specific trace takes minutes.
A typical investigation flow: pick the degradation window and endpoint from the metric, open slow traces and compare them to normal ones, pull logs for those trace_ids and check where timings increased (DB, external service, queue, network).
For example, a trace shows 1.8s spent on a database query, and nearby logs indicate a new execution plan or increased lock times. In another case an external service answers in bursts and queues build up internally. Then the latency is already “ours,” even if the root cause is external.
After finding the cause it’s important to lock in the result. Complement the fix (index, timeouts, pool settings, retries) with an alert for the specific symptom, such as p95 for the operation and queue length. Monitor the same metrics and a few traces for 1–2 days after release to confirm the issue is gone and no new side effects appear.
Quick checklist: what to check two weeks after launch
Two weeks after initial setup you can fall into a trap: data exists but brings little value. This quick check shows whether OpenTelemetry works as a unified pipeline or if you’re just collecting noise.
Check five things:
- The three signals are visible for at least one critical service: metrics (errors, latency, load), logs (errors and key events), traces (request chains through dependencies). If traces exist but metrics don’t, root-cause finding will be slow.
- Service and environment names match everywhere. The same service must not be named differently in metrics and logs (for example, billing-api vs billing). Environments should be consistent: prod, stage, dev — avoid parallel variants like production or prd.
- Logs include trace_id and basic filter fields. Minimum: level (info/warn/error), service, environment, host or pod, and trace_id. Then you can open a log error and jump to the trace.
- 3–5 alerts are configured that reflect user-facing problems. Don’t start with dozens of rules. Enough examples: rise in 5xx, spike in latency, drop in availability, growing task queue, auth errors. Each alert should answer “who cares and what will they feel.”
- Volumes are limited and predictable. Check that trace sampling is enabled, log size limits are set and retention is defined. Otherwise cost and noise will kill team motivation.
A small test: take one real incident from the two weeks and try to reconstruct the cause via the chain “alert → metric → trace → specific log line.” If you get stuck at any step, fix that step, don’t just add more data.
Next steps: solidify results and scale
After the first successful launch don’t spray efforts everywhere. If OpenTelemetry helps one service, expand the pipeline in small steps: add 2–3 services around it and one clear business scenario (for example, checkout, payment, booking). This creates end-to-end visibility faster than a set of disconnected graphs.
A repeatable process helps retain results. Agree on instrumentation rules in advance (which attributes are mandatory, how to name operations, what counts as an error), otherwise data becomes incomparable in a month. Assign dashboard owners: each key screen should have a person who ensures it reflects reality.
Minimal practices that keep quality:
- a short naming guide for metrics, logs and spans and a list of mandatory fields
- review changes to instrumentation like code reviews
- weekly check of 3–5 alerts and dashboards for noise and false positives
- training for developers and support using real incidents
Think about scaling when load and outage costs grow: many services, increasing log volume, or a single collector becoming a bottleneck. Then it makes sense to deploy separate collectors, build redundancy, plan storage and placement (including in your own DC) and verify how the pipeline behaves when a node fails.
If you don’t have time or experience in-house, you can outsource integration to a systems integrator with clear SLAs and 24/7 support. These projects often require both infrastructure and configuration. For example, GSE.kz (gse.kz) as a server manufacturer and systems integrator can help select server infrastructure for the observability pipeline, deploy it and provide round‑the‑clock support.
FAQ
How do I know it’s time to adopt OpenTelemetry?
OpenTelemetry becomes valuable when incident investigations take hours because metrics, logs and traces are scattered. It provides a unified way to collect and link signals so you can quickly find the specific service and step where latency or an error occurred.
Where should we start to avoid creating chaos with OpenTelemetry?
Start with a pilot for 2–3 services that matter to users and collect basic latency and error metrics. Then add structured logs for key events and targeted traces for 1–2 critical flows to see benefits quickly without drowning in data.
How do metrics, logs and traces differ in practice?
Metrics quickly show that something got worse and are good for alerts. Logs explain what happened but are hard to search without structure. Traces show the path of a single request across services and where it got stuck, which is especially helpful in microservices and with external dependencies.
Why use an OpenTelemetry Collector if there’s an SDK in the app?
The Collector ingests telemetry, can enrich and filter data, mask sensitive fields and forward to chosen storages. Its value is that you can change processing rules and routing without redeploying all applications.
How do you correctly link metrics, logs and traces?
Correlation works reliably via trace_id (and request_id when needed) when these identifiers appear in logs and traces and sometimes as metric attributes. Then the investigation flow becomes short: alert by metric → relevant logs → specific trace.
Which tags and naming standards should we introduce first?
The basic minimum is consistent values for service.name, environment (for example, prod/stage) and service.version so releases are visible immediately. Add stable instance or host identifiers and you’ll stop arguing about which service a graph or log is about because filters will behave the same.
Should we enable tracing for 100% of production traffic?
Don’t trace 100% of requests in production by default. Start with sampling and keep more detail only for errors and slow requests. This reduces load and storage costs while retaining enough data for investigations.
How do we avoid turning observability into a security and compliance risk?
Do not log passwords, tokens, card data or any personal data unless allowed by policy and law. A practical approach is masking and blocking collection of certain fields at the Collector level, plus clear retention periods and role-based access.
Which alerts should we prioritize to make them useful?
Alert on what the user experiences: rise in 5xx, worsening p95 latency, drop in availability of a key operation or growing queues that lead to timeouts. Infrastructure alerts like CPU are useful, but tie them to user impact to avoid noise.
How do we control cost and data volume when adopting OpenTelemetry?
Limit label cardinality, use reasonable log levels, sample traces, and set different retention for metrics, logs and traces. If you lack experience, a systems integrator can help design the pipeline and rules to keep data under control.