Open-source SIEM: a minimally useful Wazuh and Elastic deployment
How to run an open-source SIEM with Wazuh and Elastic without unnecessary complexity: event sources, basic correlations, reports and responsibilities for security and IT.
Why you need a SIEM and what “minimally useful” means
In simple terms, a SIEM is where events from different systems (servers, workstations, network, mail) are collected so you can spot suspicious activity faster and investigate incidents. The value of a SIEM is not in “storing logs”, but in answering practical questions: what happened, where, when, who was affected, and what to do next.
It’s important to distinguish: “we collect logs” is not the same as “we have security.” If events arrive without accurate timestamps, context and rules, you get noise and alert fatigue. A SIEM starts to bring value only when the minimally necessary sources are connected, there are basic correlations and a clear reaction process.
A minimally useful result (MVP) for an open-source SIEM is a small set of scenarios that are actually detected and handled. Typically an MVP looks like this:
- 3–5 key event sources are connected and reliably sending data;
- 5–10 simple correlations produce clear alerts without a flood of false positives;
- there is a dashboard for security and a short report for management (what was found, how it was handled);
- boundaries of responsibility between security and IT are defined: who fixes log sources, who investigates, who closes incidents.
After 1–2 months the MVP usually gives visibility into logins and failed attempts, basic control over critical servers and initial investigations “by event chain.” Don’t expect “complete protection,” automatic full investigation, or perfect coverage of every system.
In a small organization the MVP often starts with the domain controller, a couple of important servers and some accounting workstations. That’s often enough to catch mass password guessing or suspicious tool execution.
Roles: who does what and who is responsible
Even a well-configured open-source SIEM won’t be effective if responsibilities aren’t split in advance. For the MVP it’s important not to “cover everything” but to agree on working rules: who connects sources, who decides what counts as an incident, and who answers the phone at night.
Security usually owns the meaning and quality of results: which risks we reduce, what is considered suspicious, which alerts are needed and which are noise.
IT is responsible for getting the data and keeping it flowing. Without access, accurate host time, and change discipline, correlations quickly become background noise.
A practical division of duties in the MVP:
- Security sets requirements: which events are needed, acceptable thresholds and reactions, what counts as an “incident” and who confirms it.
- IT connects sources: enables auditing, installs agents, opens ports, provides service accounts, and tracks updates and host changes.
- Security accepts quality: checks completeness, timestamp accuracy, noise level and approves exceptions.
- IT ensures reliability: backups, disk capacity, availability monitoring of components.
Ownership of content (correlations, exceptions, reference data) often causes debate. For an MVP a simple model usually works: security owns rules and exceptions (what matters and what we ignore), and IT owns technical collection parameters (where to enable logging, how not to break a service, which changes are allowed).
To avoid overloading the team, define the support mode up front. For example: during business hours security triages alerts and creates tasks, while IT acts on requests. On-call duty is introduced only for “red” scenarios (e.g., mass account lockouts) and only after a week or two of tuning to reduce noise. This is cheaper than 24/7 response to false positives.
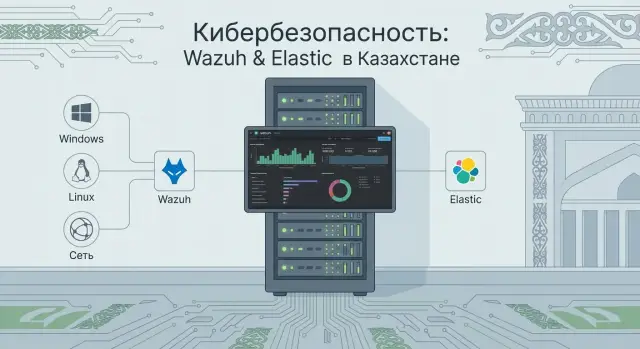
MVP architecture of Wazuh and Elastic in plain words
An MVP with Wazuh and Elastic Stack can be seen as a pipeline: collect events, normalize them, find the suspicious, and show it to people. This is not an “ideal SOC” but a maintainable minimum.
Wazuh agents are installed on servers and workstations: they read logs, watch file integrity, detect basic compromise indicators and forward data. The Wazuh Manager receives the stream, applies rules, creates alerts and enriches events (for example adding severity and category).
Next comes the Elastic Stack. Elastic stores what you need to keep and search: events and alerts. Kibana provides viewing, search, dashboards and reports.
It helps to distinguish where things live:
- raw events — original logs (as emitted by Windows, Linux, network devices);
- normalized fields — the same events but with consistent field names for searches and filters;
- alerts — results of rules and correlations, what people actually work with.
For an MVP teams often choose a single server hosting both Wazuh Manager and Elastic. This is faster to launch but demands more disk and backup discipline. If event volume is high or reliability is needed, split roles: separate machines for Wazuh Manager and Elastic (plus Kibana).
As hardware, regular servers are fine, including local vendors (for example GSE S200 Series). What matters more than brand is resources, clear support guarantees and stable maintenance.
To prevent the system from “failing silently,” control four things from day one: accurate time (NTP), disk space (especially for indices), rotation and retention, and regular backups of configs and indices.
Event sources: what to connect first
In an MVP it’s important not to collect “everything at once” but to get signals that answer basic questions: who logged in, from where, what was executed, what privileges were obtained, and what was blocked at the perimeter. For Wazuh and Elastic that means starting with the most telling points and expanding later.
Begin with assets where attacks and admin mistakes are most visible. Usually these are domain controllers, several key servers (file, mail, virtualization) and admin workstations. These sources give maximum value even with a small number of rules.
Priority starter set:
- Windows Security Log on domain controllers and critical servers (logins, lockouts, account and group changes)
- Sysmon on some systems if the team can maintain rules and filters (processes, network connections, file creation)
- Linux auth and sudo on servers (successful and failed logins, privilege escalation)
- VPN (who connected, from which address, what was accessed)
- proxy or web gateway if present (categories, blocks, suspicious domains)
Network devices are useful but add them deliberately. Firewall logs often provide quick wins: scans, blocks, unexpected outbound connections. Routers and IDS are worth adding if there’s a clear data owner and you know in advance which alerts you will investigate.
What to postpone: rare business applications, exotic log formats and trying to cover the whole estate in a week. For an organization with ~200 seats it’s reasonable to start with 2 domain controllers, 5–10 servers and 10 admin PCs, tune data quality and expand later.
Data quality: time, noise and normalization
In open-source SIEMs it quickly becomes obvious that value comes not only from correlations but from input data quality. If time drifts, events duplicate, and field names vary, investigation turns into guesswork.
Time: NTP, timezones and drift
The most common early failure is unsynchronized time. One server writes UTC, workstations use local time, and some systems are minutes behind. As a result the attack chain “breaks”: a login can appear to happen after a process start.
Minimal checks:
- enable NTP on all nodes (servers, workstations, network devices);
- choose a standard (often UTC for servers and storage);
- ensure timezones on sources are specified and parsed correctly by the stack;
- monitor drift regularly, don’t just configure once and forget.
Noise, duplicates and normalization
In the first week you almost always see an event flood: updates, scans, normal application errors. Add duplicates (e.g., identical Windows events from different channels or redelivery by an agent), and alerts become useless.
A simple order of work usually helps. First agree on standard fields: user (single format), host (FQDN or inventory name), IP (without “how it was obtained”), severity (one scale). Then apply filtering carefully: don’t “mute everything,” but remove repetitive and known-safe noise.
Manage exceptions (whitelist) as a small process:
- Security proposes an exception and justifies the risk.
- IT confirms the technical reason (why this is noise and where it comes from).
- The change is recorded: what was excluded, where and for how long.
- Each rule has an owner and a review date.
Example: OS updates on new workstations can generate thousands of events per hour after deployment. If you normalize hostnames and time in advance, you can filter out update noise without losing real login attempts or suspicious process launches.
Basic correlations that deliver value in an MVP
In an MVP it’s not about “all possible rules” but a few correlations that catch common incidents and don’t drown people in notifications. On Wazuh and Elastic start with signals that are easy to explain and quick to verify manually.
Correlations to start with
A good starter set covers accounts, access and tampering with logging:
- changes to admin groups and privileges (adding a user to local admins, domain admins, or granting logon rights to a server);
- password guessing and account hopping (many failed logins from one source followed by a successful login; series of attempts across different usernames);
- logging disabled or broken (agent stopped, log clearing, sudden drop in event volume from an important host);
- suspicious processes and persistence (execution from temp folders, creation of a new service, scheduled task, new autostart entry);
- access to critical servers (login at unusual hours, from a new host, new account or unusual subnet).
Example: in a small org an accountant normally accesses a file server only on weekdays during the day. At night there’s a successful login for their account right after 20 failed attempts, followed by a scheduled task creation. Even if it’s a false positive, checking takes minutes and yields a clear outcome.
Severity and routing without spam
Define three severity levels: low (to reports, no notifications), medium (to the investigation queue), high (urgent, with clear “what and where” text). Simple rule: notify only on high; medium goes into a daily review.
To keep the rule set manageable, maintain a backlog: goal, owner (security or IT), expected benefit, and reasons for false positives. If a rule produces no useful cases in 2–4 weeks and needs many exceptions, simplify or remove it.
Reports and dashboards: what different people really need
Reports in a SIEM are not for decoration. They help quickly answer simple questions: what failed, where is risk, who should act and how to tell if things improved. For an MVP on Wazuh and Elastic a few screens are usually enough, but each must be tied to a role and decision.
If formats are agreed in advance, the same open-source SIEM becomes useful for different groups:
- Security: an alerts panel (top triggers per day, severity, which hosts most active, which accounts appear most often) and trends (growing RDP/SSH attempts, new admin actions).
- IT: collection health report (which agents dropped, where gaps exist, delivery delays, disk or queue pressure, parsing errors).
- Management: one page with no technical details (how many incidents in the period, how many closed on time, mean response time, and the most notable risk items).
- Audit/compliance: coverage of sources (which systems are connected and since when), proof of log retention, list of significant incidents and actions.
To avoid report disputes, agree in advance what counts as an incident. Otherwise security may treat every trigger as an incident while IT considers only service outages.
How to describe an “incident” so it appears in reports
Describe rules in simple phrases and map them to event fields (severity, asset, user, outcome). A minimal set typically includes:
- condition (what happened): e.g., 10 failed logins in 5 minutes + a successful login;
- object (where): critical server, domain controller, accountant workstation;
- threshold (when it’s “enough”): count, time window, recurrence;
- reaction owner: security confirms and classifies, IT fixes the cause (or vice versa for purely technical faults);
- closing criteria: what needs to be done for the incident to be considered resolved.
Example: a new account appears in the administrators group on a server — that is an incident in the security report, and a task in the IT report to check account changes. The important thing is both reports reference the same event.
Step-by-step implementation plan for 30–60 days
Keep the simple principle: first collect and produce understandable signals, then add complexity. For an MVP on Wazuh and Elastic Stack decide in advance who makes risk decisions (security) and who is responsible for access, agents and infrastructure stability (IT).
Weekly plan
You can reach a working minimum in 30–60 days if you focus on a few systems and measurable outcomes.
- Week 1: set 2–3 goals, inventory log sources, choose 3–5 most critical systems (e.g., domain controller, mail, VPN, key app server, EDR if present).
- Weeks 2–3: install Wazuh, deploy Elastic, connect the first 3–5 sources. Immediately check time (NTP), daily event volume and where noise appears.
- Weeks 4–6: configure 5–10 correlations, add exceptions and thresholds so alerts are rare but accurate. Prepare the first simple reports for security and IT.
- Weeks 7–8: run 2–3 tabletop incidents (e.g., password guessing, suspicious night login, unknown process start), refine reaction procedures and MVP acceptance criteria.
What should remain at the end
The MVP is ready when it reproducibly provides value and can be maintained without heroics:
- list of connected sources and owners for each;
- rule matrix: what we detect, logic, priority, who reacts;
- report templates (weekly for security, technical for IT, short for management);
- RACI for support: who makes changes, who approves, who is notified, who accepts results.
A simple test: if a new person can understand where alerts come from and what to do when one fires, the MVP is properly documented.
Example scenario: small organization, few people, many tasks
Organization with 250–400 seats and 15–20 servers. IT has 6 people (admins, support, one network specialist). Security has one full-time person and another part-time. No dedicated SOC or on-call schedule.
The MVP goal was practical: see admin actions and early signs of account compromise — not “all security,” but specifically who gained privileges, who changed critical settings and where suspicious login attempts began.
They first connected sources that give maximum effect for minimal effort: domain controller (authentication and group policy), two important Windows servers (file and terminal), VPN/gateway (external logins), and antivirus/EDR detections. Workstations were added selectively: accounting, HR and admin PCs. Infrastructure was deployed on-prem to control storage and supply chain.
In the first month they enabled 6–8 rules. Most useful were those for password guessing (failed attempts followed by success), privileged account logins at odd hours, adding users to admin groups, logging disablement or log clearing, and remote admin tools launched from unusual hosts.
A couple more rules were added later (new local admins on servers, suspicious VPN logins). They quickly had to quiet alerts via exceptions: service accounts, scheduled tasks, mass password resets, vulnerability scanners. Crucially, exceptions were not made just to silence alerts; each had an owner: IT confirmed legitimacy and recorded why it should be excluded.
The first management report was one page: 3–5 metrics and 2–3 short examples. For example: password-guessing attempts per month, number of admin logins at night, times access rights changed, and two incidents that required action (date, system, result: “account blocked”, “password changed”, “external access closed”). This shows MVP value without drowning in details.
Common mistakes when launching an open-source SIEM
Disappointment usually comes from the start, not the tools. When teams connect “everything available” in week one, the platform drowns in noise: thousands of events without prioritization and useful signals lost. Start with a small set of sources and a couple of clear response scenarios.
Second problem is “alerts in the air.” If rules have no owner, notifications become background noise: nobody confirms incidents, opens tickets, or investigates. Assign an owner for each rule group (security or IT) and agree on simple statuses: “accepted”, “false positive”, “needs improvement.”
Third mistake is time. Without synchronizing clocks across servers, workstations, network gear and the stack itself you won’t reconstruct event chains. A symptom: the same action appears as different episodes.
Another common error is building correlations before verifying that fields are filled consistently. If hostnames, users, IPs or event codes fluctuate, rules will either stay silent or scream without context.
Finally, retention: if you don’t plan volumes you may run out of disk, indexing fails and you lose data right when you need it. Estimate retention and growth in advance, especially for on-prem deployments.
Keep five limits in mind at the start:
- don’t try to cover the whole perimeter at once — begin with 3–5 key sources;
- every alert must have an owner and expected action;
- time synchronization is mandatory before the first investigations;
- configure correlations only after checking field quality;
- SIEM does not replace EDR, training or access management processes.
Short checklist before going live
Before declaring an open-source SIEM “production-ready,” run a short checklist to catch typical failures: unclear goals, noisy alerts and missing processes.
5 checks to confirm the MVP is actually useful
- MVP goals are written in 2–3 sentences and understood the same way by security and IT (what we detect, why, and who it hurts);
- key sources are connected and completeness is verified: events arrive regularly, without gaps and with correct time;
- 5–10 correlations are configured with clear severity and understandable descriptions;
- there is a handling procedure: who accepts an alert, what is the first step, and what response time is considered normal;
- reports are alive: separate sets for security (incidents and trends), IT (failures, agents, coverage), and management (one page about risks and dynamics).
Operational readiness
- backups are configured (configs, rules, indices for agreed retention) and a clear recovery procedure exists;
- disk usage monitoring and data growth tracking are in place;
- updates are scheduled: who updates, how to test and rollback;
- responsibilities are assigned: IT for availability and storage, security for rules and investigations, no “grey zones.”
If any two items cause doubt, pause for a day and fix them rather than firefight in production.
Next steps after MVP: grow and support without overload
After the MVP the main task is planned growth, not adding everything at once. If core sources already provide value and first alerts and reports appear, next step is to expand coverage in a way the team can keep up with investigations and rule improvements.
How to expand without chaos
A good rule is to add one major block at a time and bring it to quality: clear fields, noise filters, tested correlations. Start with high-value sources (VPN, mail, EDR/AV, proxy or DNS), then refine rules for your processes (accounts, admin access, critical services). After that add context: lists of critical servers, system owners, maintenance windows to separate incidents from planned changes. Leave niche and rare sources for later.
When to split roles
While volume is small, one person can wear multiple hats. Split roles when alerts grow and improvements stall:
- content (rules, exceptions, reports) takes 30–40% of time;
- operations (updates, agents, disks, backups) requires regular work;
- response becomes a continuous function rather than ad-hoc checks.
To avoid infrastructure bottlenecks, estimate resources in advance: storage (how many days of logs and growth rate), backups, recovery from node failure. A common mistake is putting everything on one server without a recovery plan.
If you need to move to an industrial setup, a systems integrator can help with assessment, architecture, migration and playbooks. In Kazakhstan it can be important to rely on local infrastructure: for example, place storage and compute on domestic servers and workstations like GSE.kz (gse.kz) and arrange for support so updates, monitoring and 24/7 maintenance don’t overwhelm the security team.
Example: a small hospital adds VPN and mail logs to the MVP but sets a rule that new sources are connected only with the system owner and a clear response scenario. This sharply reduces dangling alerts and makes growth predictable.
FAQ
Why do I need a SIEM if logs are already stored somewhere?
SIEM is needed to quickly see suspicious activity and investigate incidents along a chain of events: what happened, where, when and who was affected. If you only “store logs” without timestamps, context and rules, you’ll get little benefit — just noise and alert fatigue.
What does “minimally useful result” (MVP) for SIEM mean?
“Minimally useful” means the system produces a small number of clear signals that the team actually checks and closes. Usually this is a few stable sources, several simple correlations, basic dashboards and an agreed reaction process — not an attempt to cover every system at once.
Which log sources should be connected first for an MVP on Wazuh and Elastic?
Start with points where logins, privilege escalation and admin actions are most visible. Typically that’s domain controllers, a few critical servers and admin workstations, plus VPN/perimeter logs if they already exist.
Why is time and NTP so critical in SIEM?
Without time synchronization, investigations collapse: events stop forming a correct sequence. Point all nodes to the same time source, choose UTC or a consistent timezone approach, and verify timestamps are parsed correctly into the storage.
How to quickly reduce noise and false positives in SIEM?
First, stabilize fields and standardize formats for entities like user, host and IP, otherwise rules will trigger without meaning. Then reduce repetitive safe noise gradually, recording each exception and its reason so you don’t mute real incidents.
Which correlations and rules give the most value at the start?
Begin with scenarios that are easy to explain and fast to verify manually: password guessing followed by a successful login, changes to admin groups, signs of logging being disabled, and unusual logins to critical servers. Better to have 5–10 working rules than hundreds nobody handles.
How to prioritize alerts properly to avoid spam?
Three levels are sufficient: low goes to reports, medium goes into the investigation queue, high triggers urgent notification with a clear description of what and where. This avoids waking people for minor issues while not missing urgent ones.
How to split responsibilities between security and IT when deploying SIEM?
Security (infosec) defines meaning: which risks we reduce, which rules and exceptions are acceptable, what counts as an incident and how to classify it. IT ensures stable collection and operation: access, agents, correct logging, disk space, backups and updates.
Which dashboards and reports are really needed in an MVP?
Security needs an alerts-and-trends overview to see where risk is growing. IT needs a health report about collection: fallen agents, delivery delays, parsing errors and disk pressure. Management usually wants a one-page summary with counts and short conclusions.
How to know if one server is enough for Wazuh+Elastic and how to choose hardware?
One server can be enough at the start if event volume is moderate and backups and disk discipline are in place. If logs grow or reliability is needed, separate roles and plan retention and recovery. Hardware can be domestic (for example GSE servers), but resource estimation and support matter most.