NVMe, SAS or SATA for a server: how to choose for the workload
NVMe, SAS or SATA for a server: how to choose a storage subsystem for DB, VDI and file servers, and how to read IOPS and latency during a pilot.
Start with the workload, not the drive
Begin not with “NVMe, SAS or SATA,” but with what the storage subsystem must accomplish. Drives are a tool. Users care about application response times and how stable those times are.
The “best drive type” always depends on the scenario. Databases typically demand low latency and predictability under spikes. VDI needs resilience to many small operations. A file archive usually prioritizes capacity and cost per terabyte.
The same drive can behave differently depending on the I/O profile: random or sequential access, read/write ratio, block size, queue depth. A fast drive may look great on large sequential reads but noticeably “drop” on small random writes if the controller and cache aren’t designed for that mode.
To choose correctly, first describe the workload with simple questions:
- What matters more to users: response time or total data volume?
- Is the load steady or are there short spikes (morning VDI login, nightly backup)?
- Is the workload read- or write-heavy, and how often do data change?
- Is stability without long tails required: are occasional delays 10–20x above normal acceptable?
A common mistake is choosing by marketing numbers and “max IOPS” without checking whether the test matches your profile. In a pilot, compare not the pretty numbers in a report, but how the system holds latency and throughput under your typical operations.
Briefly about NVMe, SAS and SATA — and what else matters
When comparing NVMe, SAS and SATA, it’s easy to focus only on drive speed. In real systems, more important is how the drive communicates with the server and how many requests it can serve in parallel.
NVMe runs over PCIe and is built for low latency and deep command queues. This is especially noticeable on small operations (4K–8K) and when many concurrent requests occur, because the device doesn’t choke on queues. NVMe is therefore often chosen for transactional DBs, VDI and active virtualization where predictable latency matters.
SAS is chosen where server-grade infrastructure and maintainability are important: dual-porting (for high-availability setups), compatibility with typical backplanes and ease of service in trays. SAS typically lags NVMe on latency but provides a reliable foundation for arrays and a clear service model.
SATA wins on cost per gigabyte and simplicity. It’s good for capacity tasks where volume matters more than fast response: archives, file storage with rare access, backups and repositories. Under random load and high contention, SATA reaches latency limits sooner.
Drives don’t operate in a vacuum. Before choosing, check what else can become a bottleneck in the server: which controller or HBA is used (and whether passthrough is enabled), RAID write/cache policies, how trays and backplane are wired, whether there are enough PCIe lanes and slots for NVMe, and if power and cooling can handle the density. NVMe heats up under load and throttling can easily eat the expected gain.
A simple example: in a 2U server with a dense tray, a properly built SAS array can be more useful than several NVMe drives if PCIe lanes are already consumed by network cards and accelerators. When choosing a configuration (for example, in racks like the GSE S200 Series) people look at the entire connection chain, not just the drive type.
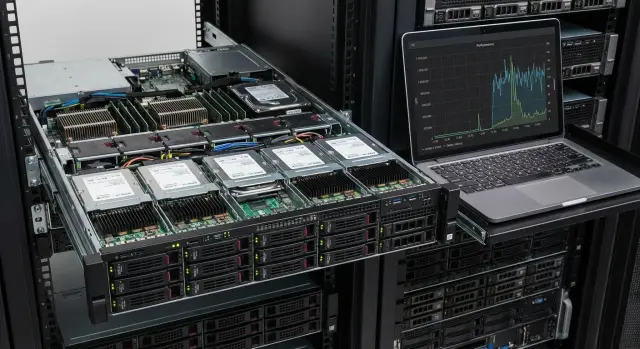
Metrics in plain language: IOPS, latency and what they hide
People often look at IOPS, but that number is almost always measured under specific conditions — it can differ greatly in your environment.
IOPS is how many read/write operations per second the storage system completes. But IOPS depends on block size, queue depth and write share. Two reports showing “100,000 IOPS” can mean different real speeds for your workload.
Latency is how long one operation takes. Users notice not the average but the occasional “hiccups.” On a pilot, percentiles matter: p95 and p99 show how long the tails are. If p99 shoots up, the system will feel “edgy” even when average latency looks fine.
Throughput (MB/s) is more relevant where large sequential streams dominate: backups, archives, dumps, copying big files. For these tasks, 5,000 IOPS may be sufficient, but hundreds or thousands of MB/s of steady throughput are important.
Block size and queue depth change the picture more than it seems. 4K resembles small I/O (often DB), 64K shows larger operations (often files). A large queue can “squeeze out” IOPS in a test but in real life cause higher latency.
Read/write mix is also critical. A 70/30 mix behaves differently from 50/50 because writes are more expensive: they require confirmation and sometimes additional controller-side work.
Before trusting datasheet numbers, check that the report lists: block size, read/write mix, average latency and p95/p99, queue depth, and for streaming tasks also throughput (MB/s). That way you compare metrics close to your workload, not “spherical” IOPS.
Profile 1: Databases
DB requirements almost always hinge on latency and predictability rather than capacity. Transactional systems (OLTP) generate thousands of small 4–16KB operations. A small increase in latency quickly turns into queues and throughput drop.
Analytics and reporting (DWH, cubes, heavy queries) more often perform long scans and reads. Here throughput, cache behavior, and how the controller/RAID handle sequential flows matter more.
Logs and journals (WAL, redo, transaction logs) are usually written sequentially and seem “easy,” but they often reveal problems first. If write latency jumps, the DB starts to “stumble” even under moderate load because commits wait on the disk.
A practical approach is to separate different I/O types into different pools. Common separation:
- Data: mixed read/write, sensitive to latency
- Logs: sequential writes, stability matters
- Temp: bursts, lots of writes
- Backups/exports: long sequential streams, throughput matters
When is NVMe justified? If you have OLTP with high contention, intensive tempdb usage, or need to shorten maintenance windows, NVMe brings a clear latency and parallelism advantage. A common setup: NVMe for data/temp and a separate fast stable pool for logs.
When SAS SSDs are enough: if the DB has moderate load and reliability and predictability are more important than peak IOPS. Typical business systems with scheduled reporting often run well on SAS SSDs for data/logs; NVMe makes sense for the hottest tables or temp if the pilot shows a bottleneck.
Profile 2: VDI and desktop virtualization
VDI punishes storage with short but severe peaks. The most typical case is the morning: dozens or hundreds of users boot their virtual desktops simultaneously. Boot and login storms rapidly increase queue depth and latency rises even if average IOPS look fine.
The workload usually includes many small random reads and writes (often 4–16KB). Add background tasks (antivirus, updates, indexing) and you get a situation where the goal is not to squeeze out maximum throughput but to keep latency low under contention.
In a pilot for VDI, look at percentile latency. Average latency may be 2–3 ms, but if p95 or p99 jumps to 30–50 ms, users will experience slowness during login, profile loading and app launches.
Useful check points:
- Record peaks separately (morning start, mass login) and their duration.
- Compare p95/p99 before and during the peak.
- Monitor queue depth growth: when it rises, latency tends to follow.
- Test behavior with background tasks: these often matter more than synthetic tests.
Caching and deduplication can greatly change disk requirements. A golden image and dedupe reduce unique reads and a fast cache can absorb some random reads. But profile writes, logs and temporary files remain and often drive peaks.
A practical VDI layout usually includes a fast pool for active VMs (clones and profiles) and a larger capacity pool for less active data, templates and backups. Splitting hot and cold reduces cost without a noticeable drop in perceived speed.
Profile 3: File server, archive and backups
For file servers and document storage, peak IOPS are usually less important than sustained throughput. Here throughput (MB/s, GB/s), network bandwidth and behavior under many simultaneous users matter.
File workloads are mixed: some users open many small files and folders (many operations), others copy videos or images (large sequential streams). With 1–10 Gbit/s networks, even fast disks may idle because the network becomes the bottleneck.
With many users, parallelism and queue control are important. Drives and controllers must sustain queue depth so that 50–200 concurrent accesses don’t become long pauses when opening files. In such scenarios SAS often behaves more predictably under sustained load, and SATA is fine when access is mostly rare and sequential.
For archive and backups the main parameters are cost per TB, reliability and predictable recovery time. SATA suits cold data and backups that are rarely read, especially if the backup window is large. If backups run every night in a tight window while daytime reads also occur, SAS offers better stability under parallel operations.
RPO and RTO are simple: RPO is how much data you can afford to lose (e.g., up to 1 hour), RTO is how fast you must recover (e.g., within 2 hours). If RTO is small, you need not only fast writes but fast reads during recovery.
Before deciding, test real network speed, folder opening time with 50+ simultaneous users, backup and restore speeds, latency behavior during backup, and array behavior during a disk failure in RAID. Then it becomes clear where to spend on speed and where capacity and predictability suffice.
Where NVMe makes sense and where it’s overkill
NVMe shines where low latency and many concurrent operations matter. If your services daily hit the storage limit, the effect is immediate. If another layer is the bottleneck, you’ll pay for speed the system cannot use.
NVMe is typically justified for workloads like:
- OLTP databases with frequent small reads/writes
- VDI and dense virtualization with many concurrently running VMs
- logs, queues, caches, temp data — the “hot” tier
- analytics with high parallel queries where disk queue grows quickly
- services sensitive to latency (authentication, billing, critical APIs)
NVMe often provides little benefit when CPU, memory, network or the application are the bottleneck. Typical signs: DB queries are CPU-bound, file server limited by network (1–10 Gbit/s), backups and archives are sequential by schedule, application lacks parallelism.
Practical risks: NVMe can heat and throttle under long writes, so cooling must be validated. Another surprise is PCIe lanes and slots: you may plan for 8 NVMe but end up with fewer usable slots. Compatibility also matters: not every RAID/HBA and server profile works the same with specific drives.
Handle resilience separately from speed: mirroring or RAID, performance headroom under degradation (one failed disk) and a clear replacement plan. A layered approach often wins: NVMe for hot data (DB, VDI, logs), SAS/SATA for the rest. In racks like the GSE S200 Series this helps avoid overpaying for terabytes that don’t need the lowest latency.
SAS and SATA: practical scenarios and trade-offs
When choosing between SAS and SATA, the conversation usually focuses on predictability, cost per TB and operational convenience rather than peak speed.
Choose SAS SSD when load is steady and uneven: many small operations, queueing, frequent peaks. SAS tends to be more stable in typical server setups with standard backplanes and controllers and is handy where uniform service procedures matter.
SATA SSD is reasonable for moderate loads when you need more capacity for the budget. Examples: VMs without heavy DBs, application servers, small mail systems, “warm” data. The trade-off is simple: lower price for less headroom and sometimes less stable latency during peaks.
HDDs (SATA or SAS) remain suitable for archive, backups, media and cold data. They lose on latency but win on cost per TB. A practical pattern is SSD for working data and HDD for archive and backups.
For TCO comparisons, look beyond drive price: will you need RAID/HBA licenses, how many spares, how fast can replacements be performed, what about power and cooling in a dense tray, the operation and on-site support costs, and SSD endurance (TBW/DWPD) for your write profile.
Ask suppliers practical questions about support and deliveries: how is “normal wear” defined, what are confirmed lead times and batches, who provides support in your region, what happens if a drive model changes mid-life, and is the drive compatible with the chosen chassis and controller.
How to run a storage pilot: steps without unnecessary theory
A pilot is not for a pretty IOPS number but to find out whether the system will handle your real peaks and whether delays will appear that “hang” the service.
First, describe the workload in plain terms: how many users, when peaks occur, what matters most — response time or throughput. Example day: morning 200 simultaneous VDI logins, daytime 1C/DB workload, nightly backups and reports.
Then pick 1–2 I/O profiles close to reality: block size (often 4K for DB/VDI, 64K–1M for files and backups) and read/write mix (e.g., 70/30 or 50/50). One “average” test almost always deceives.
Set goals before testing. Minimum — p95/p99 latency and the lower bound of IOPS at which the service remains comfortable. If p99 spikes, users notice it even if the average looks fine.
Test on a configuration as close to production as possible: same controller, RAID, filesystem, cache settings, same network paths. And run peak scenarios: morning VDI, DB batch operations, nightly backup.
Short pilot plan:
- describe services and peaks over time
- choose 1–2 I/O profiles (block, read/write mix)
- define SLOs for p95/p99 and minimum IOPS
- test on the final topology (controller, RAID, FS)
- separately test peak windows and background tasks
This shows where NVMe is truly needed and where SAS/SATA suffice without overspending.
How to read results: what matters beyond a single IOPS number
IOPS are useful for comparison, but they don’t guarantee anything by themselves. Two configurations can show the same IOPS yet feel different to users due to latency. So look at the full picture.
The main thing is latency and its tails. Average latency often looks fine until you inspect p95 and p99. Rare long delays cause VDI freezes, slow DB transactions and file copy stalls. It helps to view latency over time: waves or growth towards the end of a run usually indicate a hidden issue.
Next, find the real bottleneck; otherwise you’ll “treat the drives” while the problem lies elsewhere:
- CPU: utilization and iowait, especially on controller cores
- queue: growing queue depth at the same throughput hints at a bottleneck
- controller and bus: HBA/RAID limits, PCIe, cache settings and write policies
- network: if testing through SAN or distributed storage, watch RTT and losses
- throttling: SSD heat and speed drop after cache is exhausted
Compare results for different block sizes and queue depths. 4K random with QD1 is closer to application responsiveness; 128K sequential shows how backups and large files behave. If the system “comes alive” only at high QD, that signals it will underperform in real loads with short queues.
Test stability with a long run. Ten minutes can be perfect, while after an hour GC or cache exhaustion causes spikes.
Always translate metrics into user experience: for VDI measure desktop boot and app launch times, for DB measure typical query response and peak behavior, for file servers measure folder open times and small-file copy speed.
Common mistakes in selection and piloting
The most common mistake is comparing options by a pretty IOPS figure in a datasheet. Real life depends on block size, read/write pattern, queue depth and — most important — latency under load. Two solutions with similar IOPS can feel very different.
The second trap is a “sterile” pilot. Tests are run on a clean system, then production adds encryption, antivirus, snapshots, replication, dedupe or integrity checks. Latency rises and users see slowdowns where tests looked fine.
What usually breaks a comparison
Problems stem from incomparable conditions:
- comparing different RAID levels or filesystems and blaming “a slow drive” when write logic changed
- taking max IOPS without specifying block size (4K vs 64K are different worlds) and without latency requirements
- not accounting for peak events: RAID rebuild, background checks, backup, security scans
- testing too briefly (5–10 minutes) and missing behavior after warm-up, cache fill or heat buildup
About growth and headroom
Pilots are often designed just “tight” on capacity and performance. This is risky: in a year new VMs, DB growth, new reports and backup windows appear. Keep reserves not only in TB but also in latency at peak.
Practical example: a pilot showed comfortable 2–3 ms, but after enabling encryption and nightly backup latency became 15–25 ms, and VDI users complained in the morning. Reproduce such scenarios with your integrator and support before going live.
Short checklist for choosing storage
A useful formula: workload — goals — constraints. Even if the question is “NVMe, SAS or SATA,” the answer appears only after describing the actual system work.
Before picking drive models document this (often one page is enough):
- Workload profile: what matters today — DB transactions, VDI storms, large files, backups, or a mix (and which in that mix has priority).
- Measurable goals: latency p95/p99 (not only average), minimum IOPS during a typical peak, required throughput (MB/s) for streaming tasks.
- Server constraints: how many PCIe lanes and NVMe slots, how many 2.5/3.5 bays, which controller and backplane, is cooling and power sufficient for dense deployment.
- Resilience: required RAID or mirroring, performance headroom during degradation, how fast and by whom disks will be replaced.
- Pilot plan: which tests reproduce your day, what values count as success, and how to explain results to the business (e.g., “desktop opens within 15 seconds 99% of the time”).
When building a server from scratch, confirm tray, controller and drive compatibility with your integrator in advance. This saves weeks of rework after procurement, especially in government and large organization projects.
Next steps: from choice to working configuration
Once it’s clear where NVMe is needed and where SAS/SATA suffice, move to a plan. Start with 3–5 questions: what is currently slow (app start, reports, user logins, backup), what peaks occur during the day, what growth is expected in 12–18 months.
Then prepare 1–2 configurations for a fair comparison. Often a simple scheme works: a fast tier for hot data (and logs/temp if needed) and a separate capacity tier. Don’t try to guess an ideal — you need a clear difference in latency and stability.
To avoid subjective debate, run a pilot on a typical server and repeatable scenarios: morning VDI login, daytime DB report, evening backup. Execute the same tests on each configuration and compare not only IOPS but p95/p99 latency, peak behavior and degradation margin.
If the project is in Kazakhstan, factor in local support and service. Sometimes relying on a local vendor and integrator is helpful: for example, GSE.kz (gse.kz) supplies GSE S200 servers and offers 24/7 technical support, which helps bring a pilot to a stable working configuration faster.
FAQ
Where should I start when choosing: NVMe, SAS or SATA?
Start from the I/O profile, not the drive interface. - What operations dominate: small random (4–16KB) or large sequential (64KB–1MB)? - What matters more: minimal latency or cost per terabyte? - Are there peaks (morning VDI login, nightly backup) and how critical are they? After answering this, it becomes clear where NVMe is needed and where SAS/SATA suffice.
Why shouldn’t I choose drives by maximum IOPS in the datasheet?
IOPS without context are almost useless: they can be inflated by block size and queue depth. Look for at least: - *Latency* and percentiles p95/p99 (they show the “hiccups”) - block size (4K and 64K are different workloads) - read/write mix (e.g., 70/30 vs 50/50 behave differently) - queue depth (how many concurrent requests) If a report lacks these details, the comparison will be unfair.
Which metrics matter most: IOPS or latency?
Users perceive not the average throughput but the occasional long delays. Practical guide: - average latency shows “overall” behavior - p95/p99 reveal tails that cause VDI stutters, DB commit delays and slow folder opens If p99 spikes to tens of milliseconds during peaks, the system will feel “jittery” even with good average IOPS.
When does NVMe give a noticeable benefit?
NVMe is typically chosen when low latency and high parallelism are essential: - OLTP databases with high contention - VDI and dense virtualization with login/boot storms - hot temporary data (temp, caches, queues) If the bottleneck is CPU, memory, network, or the application cannot parallelize, NVMe may produce little benefit and be an unnecessary expense.
When is it smarter to choose SAS instead of NVMe?
SAS is often preferred when operational stability and predictability in the server ecosystem matter: - reliable operation with trays/backplanes and standard server setups - easy maintenance, replacements, standardized procedures - arrays where a clear model of redundancy is required NVMe usually wins on raw latency, but SAS SSDs often meet requirements in typical server tasks without extra cost.
For which tasks is SATA a sensible choice rather than a compromise?
SATA is chosen when capacity and cost per terabyte are the primary concerns: - archives and “cold” data - backups that have wide time windows and are rarely read - file repositories with mainly sequential streams Limitation: under high contention and random workloads, SATA quickly shows latency growth, so it’s usually not suitable as a primary tier for active DBs/VDI.
How to pick drives for a database so logs and temp don’t become bottlenecks?
For OLTP, small operations and stable writes (especially logs) are critical. Practical approach: - separate Data / Logs / Temp into different pools when possible - verify write latency for logs (latency spikes often hit commits) - avoid a single shared volume for everything A common working setup: fast tier (NVMe or SAS SSD) for data/temp and a separate stable pool for logs — but validate with a pilot.
What to check in VDI to avoid morning slowdowns?
VDI suffers from short, intense peaks (boot/login storms) where maintaining low latency matters more than showing a nice average number. What to check: - p95/p99 latency during mass login - queue depth growth during the peak - impact of background tasks (antivirus, updates, indexing) If p99 rises to 30–50 ms during the peak, users will notice slowdowns regardless of normal average IOPS.
How to run a storage pilot without deceiving yourself?
Make the pilot resemble real operation; otherwise results will be overly optimistic. Mini plan: - describe the system’s “day”: users, peaks, nightly windows - choose 1–2 I/O profiles (e.g., 4K 70/30 for DB/VDI and 128K sequential for backups) - set targets for p95/p99 and minimal throughput/IOPS in advance - test on the final layout: same RAID/HBA, cache policies, filesystem Also run a long test to reveal throttling, SSD garbage collection and cache warm-up behavior.
What aside from the drives most often limits speed and latency in a server?
Most often the bottleneck is not the drive type but the surrounding components and conditions: - RAID/HBA and write policies (write-back/write-through) - passthrough mode if your architecture requires it - PCIe lanes and NVMe slots (often fewer in practice than on paper) - cooling: NVMe can throttle under prolonged writes Before buying, verify the configuration can handle degraded states (RAID rebuild, disk failure) without exceeding your latency limits.