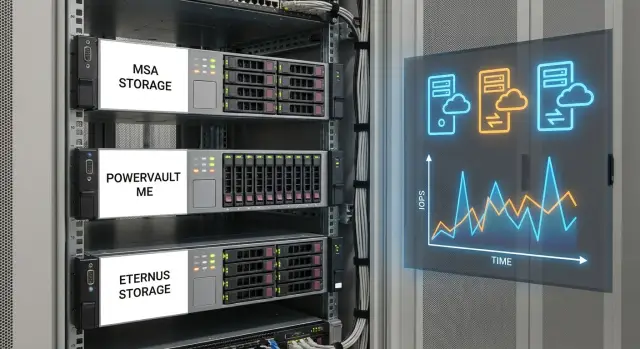
Mid‑range storage for virtualization: MSA, ME, ETERNUS
Mid‑range storage for virtualization: how to compare HPE MSA, Dell PowerVault ME and Fujitsu ETERNUS by IOPS, shelves and cache without mistakes.
What people argue about when choosing storage for virtualization
In virtualization many start by asking about terabytes, but quickly hit a different issue: how fast the storage serves data and what latency shows up on reads and writes. For users it’s simple: “the VM is slow.” In reality this is often not lack of CPU or RAM but the queue of disk operations.
So two systems at roughly the same price can behave very differently with the same set of virtual machines. One keeps latency steady and weathers spikes, the other drops sharply under the same load. The difference usually hides in details: controller architecture, cache, disk groups and connections to hosts.
When people say “mid‑range storage for virtualization” they usually mean arrays suitable for production (redundancy, proper interfaces, the ability to expand with shelves) but not designed for infinite IOPS or dozens of heavy databases at once. This is the level where it’s important to understand limits ahead of time, so you don’t buy a system that is barely enough.
Most debates focus on what will become the first bottleneck: performance (IOPS and latency), expansion by shelves and capacity, cache and controller behaviour under peaks.
A simple example: in a cluster with 30–50 VMs everything is fine until morning user logins, updates, antivirus scans and backup start. At that moment the issue is not capacity but peak writes and many small random operations.
So when choosing between HPE MSA, Dell PowerVault ME and Fujitsu ETERNUS, discussion is less about brand and more about the forecast: what load will you have in a year and where do you want headroom — latency, expandability or cache.
Metrics without which comparison is meaningless
Comparing mid‑range storage for virtualization by a single brochure number is useless. The same system can show excellent lab results and hit latency limits in real life if the test conditions don’t match your workload.
IOPS, MB/s and latency answer different questions:
- IOPS matter for many small operations (typical for VMs and databases).
- MB/s shows stream throughput, for example for backups or large files.
- Latency is often the most important: even with decent IOPS users will complain if response times jump and grow at peaks.
A separate trap is queue depth. Results depend heavily on queue depth: the higher it is, the easier it is to “spin up” IOPS, but that may not resemble VMware or Hyper‑V behaviour in your setup. For virtualization it’s better to aim for low and stable latency at moderate queue depth than records at an inflated depth.
RAID and disk type change the picture drastically. SSD vs HDD is obvious, but remember the write penalty of RAID 5/6: writes become more expensive and latency grows. Controller cache can smooth peaks but doesn’t change RAID math or disk limits.
Finally, the bottleneck is often not the disks themselves but the surrounding components: controllers, ports, host interfaces and multipath setup.
Before comparing MSA, ME and ETERNUS fix identical conditions: workload profile (read/write ratio and block size), acceptable peak latency, queue depth and number of threads, RAID and disk types, presence of write cache, and speed and quantity of ports on the storage and hosts.
When these parameters match, numbers become comparable and the choice becomes much easier.
IOPS limits: how to know if it will be enough
People often compare only “IOPS from the brochure.” Those numbers are usually obtained under friendly conditions: small blocks, high read percentage, many parallel threads and a tuned set of disks. In real life VM workloads are mixed. Actual IOPS are almost always lower, and latency matters more than a peak record.
Start by asking how the number was obtained. The same array may show “nice” IOPS on 4K reads and fall noticeably on 8K–16K, under mixed read/write or with fewer threads. For virtualization look at scenarios with random access + 60/40 or 70/30 read/write and measure latency at levels you’re willing to accept inside guest OSes.
Things to clarify with the vendor or in the pilot report:
- block size and read/write ratio;
- number of threads and queue depth;
- RAID type and how many disks participated in the test;
- what latency was at the claimed IOPS, not only the “maximum”;
- what happens during degradation: rebuild, disk failure, pool filling.
Mixing NVMe, SSD and HDD in one system also brings surprises. “Fast” disks may not reveal their performance if hot data constantly falls to a slower tier, tiering algorithms don’t match your workload, or the controller is bottlenecked on writes and data protection.
A practical guideline: capture current IOPS and latency on hosts (or the old storage), add growth projections for VMs and services and include headroom. A reasonable IOPS buffer is often 30–50% for growth and peaks, plus a separate reserve for "bad days" like rebuilds and updates when the profile suddenly becomes write‑heavy.
Shelf and capacity limits: how to plan growth
While debates often start with IOPS, purchases usually get derailed by capacity growth. Every product line (HPE MSA, Dell PowerVault ME, Fujitsu ETERNUS) has a maximum number of disk shelves, but real scaling is limited by more than specification numbers.
Raw terabytes rarely equal usable capacity. RAID consumes space for protection, you often need a hot spare, and you should reserve room for snapshots, replication and breathing space for pool operations. If you plan to use 95% of a pool, expect trouble: speed drops, latency rises, and maintenance (rebuilds, data redistribution) starts to noticeably impact VMs.
When expanding a pool you usually see one of two behaviours. Either the array actively redistributes data for a while (raising latency), or you create a new pool and migrate workloads manually. The second approach is often easier to control. Adding shelves can increase both capacity and performance (more disks or more SSD), but if you've already hit limits of controllers, cache or ports, new disks won’t help.
Practical way to estimate growth
Keep the plan simple:
- calculate usable capacity: RAID + hot spare + at least 20–30% free space;
- decide in advance how you will scale: same disk type or a separate pool;
- check maintenance tolerance: rebuild on large disks can take long;
- include rack planning: RU, weight, space for cables;
- check engineering: power (A/B), PDUs, cooling and noise.
Sometimes the rack and power become the ceiling before the shelf limits. Plan capacity together with the site, not only by price and specs.
Cache and controllers: when it really matters
Controller cache is fast memory where storage temporarily places data so it doesn’t wait for disks. In virtualization this is most noticeable during peaks: many VMs booting, mass updates, log storms and temporary files.
The mode that affects response is write‑back. In write‑back a write is acknowledged once it reaches cache and is flushed to disks later. This reduces latency and raises IOPS for small writes but requires protection against power loss. That’s why batteries or supercapacitors (sometimes with non‑volatile memory) matter so the cache doesn’t vanish on power failure.
If the array has two controllers, look not only at total cache size but also at protection logic. Mirroring cache between controllers is good practice: one controller accepts a write and the second gets a copy. Then, if one controller fails, data isn’t lost and the system returns to normal faster.
Cache barely helps when disks are already faster than the workload or when the working set is too large to fit in cache. You’ll see this in scenarios like long reads of large datasets without repeats, when bottlenecks are in the network or hosts rather than storage, or when all‑SSD setups are limited by controller CPU and queueing. Also beware of features that change I/O profile significantly.
In the model description check specifics: cache per controller and how much is actually available; whether write‑back is default and what conditions disable it; how cache is protected on power loss; whether cache is mirrored; how controllers behave on failure and how fast failover occurs.
Interfaces and connectivity: where IOPS get lost
Even powerful storage can show “poor IOPS” if the bottleneck isn’t disks or controllers but connectivity. For mid‑range arrays this is common: the array is tested but in practice limits are hit in the network, ports or multipath configuration.
FC, iSCSI, SAS: ease and latency differences
FC usually gives predictable latency and fewer surprises from shared traffic, but requires FC switches and zoning discipline. iSCSI is easier to start with because it runs over Ethernet, but needs a careful network (speed, buffers, jumbo frames, no unnecessary routing). SAS looks simple and short but is less flexible for scaling and often limits topology.
In practice differences show quickly: mixing storage and regular traffic on iSCSI can let latency growth erase SSD benefits. With FC you can get great numbers but lose them due to wrong zoning or overloaded ISLs between switches.
How many ports do you need and why MPIO is mandatory
Plan ports for redundancy, not just to "make it work." For a typical virtualization cluster keep at least two independent paths from each host to the two storage controllers.
A practical base scheme: two segments (A and B) or two independent switches; at least two storage ports per host and two ports per controller; MPIO on hosts with a clear balancing policy; separate paths across different NICs/HBAs, switches and VLANs/VSANs.
MPIO is needed not just for failover. It evens load across paths so one path doesn’t become a "traffic jam" that lowers IOPS and raises latency.
Common mistakes: iSCSI over overloaded switches without QoS, one big VLAN for everything, mismatched MTU segments, wrong LACP. In FC you often see extremes: all hosts in one zone or an overly complex scheme without clear diagnostics.
Step‑by‑step: how to choose between MSA, ME and ETERNUS
Choosing between HPE MSA, Dell PowerVault ME and Fujitsu ETERNUS usually comes down to whether a specific configuration will handle your real workload. For mid‑range virtualization storage it’s important to compare solutions under the same conditions: same disks, same RAID, same number of shelves and same connection bandwidth.
First agree with the virtualization team on inputs: how many VMs will live on the array, which services are critical (databases, VDI, file services), growth rate and how many daily peaks you expect.
A simple algorithm helps:
- capture facts from the current environment: average and peak IOPS, read/write ratio, block size, latency per datastore, fullness and growth rate;
- set target latency for key services (separately for databases and regular VMs);
- prepare 2–3 candidate configurations with equal usable capacity and protection level;
- check scaling limits: max shelves, disks, cache, ports and what happens to performance during growth;
- compare with the same test scenario: same VMs, same profiles, same peak windows.
Then add headroom. In virtualization headroom disappears quietly: a couple of VMs are added, snapshots enabled, nightly backups run, and latency creeps up.
To avoid endless debates, define acceptance criteria before deployment: peak latency limits for critical services, growth buffer (e.g. 30–40%), achievable usable capacity with RAID and hot spare, a clear expansion scenario and how you will monitor and validate results after launch.
If you want to reduce risk at selection time, work from measurements and target latency rather than capacity. A systems integrator like GSE.kz can help: they often start with a short questionnaire and measurements, then propose several configurations and connection schemes to surface real limits before deployment rather than after.
Typical virtualization workloads and how they hit storage
The same array behaves differently depending on workload. Comparing systems only by “IOPS in the spec” is risky: virtualization usually results in a mix of reads and writes, random and sequential operations.
Common profiles in a cluster:
- databases: many small random operations, stable latency is more important than peak IOPS;
- VDI: sharp bursts (morning logon, updates), heavily dependent on cache and write policy;
- file services: moderate throughput but many metadata and small ops that tax disks;
- backups: long sequential streams that can saturate channels and disturb production VMs.
The problem of “average temperature” is that 80% of the time everything is calm, and 20% the system is bottlenecked and users feel slowdowns. Daily average latency can look fine, but short spikes to 20–50 ms already make VDI and databases unpleasant. So monitor not only the mean but also the 95th and 99th percentile latencies.
For basic redundancy mid‑range storage usually needs at least: two controllers, two independent paths to hosts (multipath) and two switches (or two independent FC fabrics). Skimping on a second path turns any small issue into downtime.
Snapshots and replication also consume resources. Check where snapshots are stored and how they grow under active writes, snapshot frequency and retention, replication windows and what matters more for you: RPO/RTO or daytime steady performance.
A practical rule: schedule heavy databases, VDI and backups by time or separate them into pools. Otherwise invisible background load will quickly eat the latency buffer.
Practical example: a virtualization cluster in a company
A typical mid‑range scenario: the company has 2–3 clusters (prod, test, a separate zone for critical services), totalling 40–80 VMs. Two services keep the business running (e.g. a 1C database and mail), and there's a pilot VDI for 20–30 seats.
Before sizing storage collect inputs. The most common failure is sizing by capacity only, missing peaks and background tasks.
Questions that change the final configuration:
- when do IOPS and latency peak (morning, month‑end, scheduled closures)?
- are there "noisy neighbours" — VMs that periodically consume disks (antivirus, indexing, reports)?
- how is backup organised (snapshots, replication, nightly full copies)?
- what growth is planned for 12–24 months in VMs and data?
- do you need a separate pool for VDI so it doesn't affect critical services?
Then map workloads into pools. In this example the logic is simple: a fast pool for critical services and VDI, a universal pool for most VMs, and an archive pool for files, logs and infrequently used images. That lets you choose disks wisely and avoid paying for speed everywhere.
Compromises are usually about priorities, not brand: more capacity on NL‑SAS (cheaper but higher risk of hitting latency at peaks), more SSD (faster but requires growth control), max shelves “for the future” (plus for expansion, minus for power and space), cache and a second controller (more expensive but steadier under mixed load).
Common mistakes in selection and procurement
The most common mistake is comparing IOPS as an isolated number. One vendor’s test is 100% reads, another’s 70/30, a third inflates queue depth. For virtualization the important combo is latency under mixed load and its stability as queue depth grows.
Second pain is buying capacity "to the limit." RAID consumes disks for parity/mirroring, plus you need room for rebuilds, snapshots, metadata and future VMs. If you buy exactly what you use now, restrictions appear in months: you can’t expand easily, and you lack emergency buffer.
Often production and backup are mixed in the same pool, killing predictability. A nightly multi‑stream backup can eat the queue and cause VM latency spikes. Better separate pools or at least apply clear limits to copy tasks.
Another trap is skimping on the network. The bottleneck is not the array but a single switch, a pair of 10GbE ports, mismatched MTU, missing multipath or host iSCSI/FC misconfiguration. The array then looks weak though the problem is elsewhere.
Before purchase check five things:
- test conditions: block, profile, queue, read/write ratio and target latency;
- capacity calculation including RAID, hot spare, snapshots and growth buffer;
- separation of production volumes and backup targets (or clear limits);
- network throughput and redundancy (ports, paths, settings);
- compatibility: firmware, MPIO/DSM, drivers and your VMware or Hyper‑V version support.
Pre‑purchase checklist and next step
Before buying put on one page what cannot be guessed during the project. This quickly shows where MSA, ME or ETERNUS hit limits in your scheme.
First record measurable application and business requirements:
- target latency during working hours and at peak, separately for critical VMs;
- capacity growth for 12–24 months and acceptable maintenance windows for expansion;
- the most sensitive services (VDI, DBs, files, backup) and their read/write profile;
- RPO/RTO requirements and what counts as “recovered”;
- site constraints: power, racks, available SAN/LAN ports.
Then verify the chosen configuration won't “run out” earlier than planned. Important are not only disks:
- how many shelves can be added without replacing controllers and how many ports remain;
- pool, RAID, thin, snapshot and replication limits (if needed);
- performance reserve: behaviour under degradation (single controller, rebuild, disk failure);
- two independent host‑to‑storage paths and clear monitoring;
- maintenance procedures: who and how replaces disks, controllers, batteries or cache modules.
Plan deployment: first attach new storage to a test host, run a workload similar to your "Monday 10:00", and only then migrate production. Acceptance criteria are simple: meet target latency, survive peak IOPS and pass failure scenarios according to procedure.
If you want to reduce risk during selection, work from measurements and target latency rather than capacity. A systems integrator can help — for example GSE.kz typically starts with a short questionnaire and measurements, then offers a few configuration options and a connection plan to surface real limits before launch, not after.
FAQ
Should I start storage selection for virtualization from capacity or performance?
Start not from terabytes but from latency and the I/O profile. For virtualization it's more important to have stable *latency* at peak under mixed read/write, because that's what users perceive as “VM is slow”, even when capacity is fine.
What matters more for virtualization: IOPS, MB/s or latency?
IOPS are the number of operations, MB/s is the data throughput, and latency is the response time per operation. For virtual machines latency usually matters most: users will complain if response times spike, even with "good" IOPS.
Why do published IOPS rarely match reality?
Because those numbers are often taken in a “friendly” test: small blocks, high read ratio, many threads and deep queues. Ask how the measurement was done and check the latency at those IOPS, not only the maximum value.
How to know if storage will be enough in IOPS for the next 1–2 years?
Base your estimate on measurements from your current environment and add headroom for growth and peaks. A practical minimum is +30–50% over observed peaks, plus a separate reserve for bad days like rebuilds, updates and heavy backups when writes spike.
How does RAID affect latency and why writes are often a problem?
RAID 5/6 imposes a "write penalty", so with mixed workloads latency grows faster than you’d expect from capacity numbers alone. For virtualization this is most noticeable during write peaks (logins, updates, antivirus, backups), so choose RAID level based on write profile, not only usable terabytes.
How much usable capacity will I really get and why not fill a pool to 95%?
Never plan a pool to the brim: when highly filled, performance drops and maintenance interferes with VMs. Calculate usable capacity including RAID and hot spare and leave at least 20–30% free so the pool can handle growth and rebuilds smoothly.
When does controller cache actually improve VM performance, and when doesn't it?
Cache helps most on small write bursts if write‑back is enabled and protected against power loss. It won't help if the bottleneck is ports, network or controller CPU, or if the working set is too large to fit in cache.
How many ports and paths are needed for normal storage connectivity in a cluster?
Minimum: two independent paths from each host to the two storage controllers and properly configured multipath. Without MPIO you lose both redundancy and part of performance — a single path easily becomes a "bottleneck" and latency rises even on fast disks.
Which is better for virtualization: iSCSI or FC, and where do IOPS usually get lost?
iSCSI is usually easier to deploy but needs a well‑tuned Ethernet network, otherwise latency will vary with other traffic. FC gives more predictable response but requires discipline in zoning and FC infrastructure. Choose what you can operate and troubleshoot reliably.
How to compare HPE MSA, Dell PowerVault ME and Fujitsu ETERNUS without brand arguments?
Fix identical comparison conditions: same disk types, RAID level, number of shelves and connection bandwidth, then check latency at a real peak (e.g. Monday morning). If you want less risk, an integrator like GSE.kz can start with a short questionnaire and measurements, then propose several configurations and a connection plan tailored to your rack, network and growth limits.