Loki or OpenSearch for logs: a comparison for a small team
Loki or OpenSearch for logs: a comparison of storage, search speed, disk cost and operational requirements for a small team.
Why compare Loki and OpenSearch at all
When logs are few, almost any setup feels fine: write to a file, grep sometimes, maybe put everything in one index and not worry about the future. But when services grow and logs reach tens of gigabytes per day, common pains appear: the needed line takes minutes to find, disks fill up unexpectedly, and the team spends time on incidents instead of the product.
So the question "Loki or OpenSearch for logs" usually comes not from curiosity but from fatigue. The storage choice directly affects budget (what disks and how many days to retain) and the team’s nerves (how much time on support, upgrades and recovery after failures).
Logging solves different tasks that pull the system in different directions. Most often you need to:
- quickly find an error by trace-id or a fragment of a message
- reconstruct the chain of events before an incident (timeline)
- perform an audit: who did what and when
- get simple counts and metrics from logs
Comparing Loki and OpenSearch matters because they "pay" for convenience differently. One option may be cheaper for storage, another faster and more flexible in search but noticeably more expensive in resources and operations.
From here on without complications: imagine a small team that runs the system themselves, is time-limited and wants predictable costs, not a six-month project.
Basic concepts in simple terms
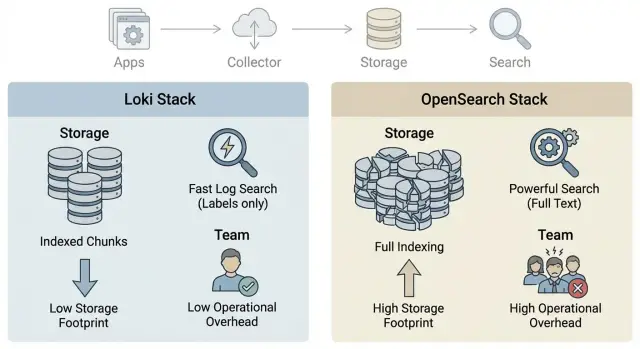
The log path is usually simple: the application writes lines (or JSON), an agent picks them up, sends them to storage, and you search and view results in an interface. The difference between Loki and OpenSearch starts at storage and search.
OpenSearch (like Elasticsearch) relies on indices. Think of an index as a table of contents: a predefined structure that helps find entries quickly. Speed costs disk and resources, because not only the original log text is stored but also metadata for search.
Loki tends to store logs closer to an "archive": the focus is on compressed text and labels. The idea is that labels let you quickly select a stream (for example, service=api and env=prod), and then you search within that selected range. Content indexing is usually lighter, so storage is cheaper, but searching "any word anywhere" can be harder. It depends more on how well labels are designed.
Summed up in two approaches:
- OpenSearch: more structure and indices, faster for complex queries, more expensive to store and operate.
- Loki: fewer indices, cheaper storage, labeling discipline matters, text search relies on good pre-filtering.
Around either system you’ll typically have the same components: log collector on nodes, delivery (buffer and retries), storage, and visualization with dashboards and alerts. If your team is small, decide upfront who owns field or label schemes, retention and access. These "small things" later determine speed, cost and the number of midnight incidents.
Log storage: volume, retention and disk types
Storage fuels most debates about Loki vs OpenSearch. These systems lay out data differently and therefore use disks differently.
In OpenSearch logs become indices and segments on disk. This is convenient for complex searches, but an index often occupies noticeably more space than the original text. Local SSDs are commonly used in a cluster; data is sometimes split into "warm" and "cold" tiers.
Loki keeps a minimal index (mainly labels) while logs themselves are stored in compressed chunks. For a small team the most economical option is often to keep chunks in object storage (S3-compatible or similar) and leave only what’s needed for operation and cache on local disks.
Volume growth rarely depends only on the number of services. It’s far more influenced by detail level (INFO vs DEBUG), frequency of repetitive events and format. If every event is a large JSON with duplicated fields, storage balloons.
Retention length almost always matters more than disk type. Seven days vs thirty days is not a "small" difference but often 4x+ in space, affecting cost, backups and recovery time.
To keep costs under control, decide in advance what will be hot (last 3–7 days on SSD) and what can be cold (weeks or months on cheaper storage). Also decide which logs can be kept shorter (for example, debug logs) and which fields aren’t needed in every message.
Small example: a team writes 50 GB of logs per day. With 30-day retention that’s already 1.5 TB of raw data, and with indices, replicas and room for growth it becomes several times larger. So "how many days to keep" and "where the cold layer lives" typically have a bigger effect than saving a few percent on disk type.
Search speed: what really matters
By "speed" people usually mean common tasks: find an error by trace-id, view events for a specific user, filter 500 responses, or quickly gather a sample for the last 15 minutes. What matters is not only the platform but also how you describe the data.
In OpenSearch speed relies on indices and fields. If you predefine and index needed fields (trace_id, user_id, status_code, service, env), point queries remain fast even at large volumes. If everything is put into one big text field, the system must do heavy searching and response times grow.
In Loki labels and pre-filtering play the main role. A good query first narrows by several labels (e.g., service + env + pod), then searches for a string or pattern inside. If labels are few or too general, Loki will read more data and searches will slow down.
Common speed boosters for both models are the same: a clear schema (consistent field names), narrow time windows, filters by source (service, environment, cluster), and then full-text search. Structured JSON logs are almost always easier to filter than "text about everything."
What slows things down is the opposite: full-text search without filters and time limits, queries like "show all errors for a month" without purpose, overly broad labels or fields, and uncontrolled cardinality (e.g., using request_id as a label).
Measure speed fairly on equal data volume and identical queries that your team actually runs. Pick 3–5 typical scenarios (trace-id, user, 500s, specific service, peak load) and run them against the same period. Often "slowness" is due less to Loki or OpenSearch and more to unstructured logging that leaves nothing to filter.
Cost: disks, resources and hidden expenses
Cost discussions usually start with disks but end with how many nodes you’ll need for acceptable speed.
Budget has five parts: storage space, CPU and RAM for ingestion and queries, network (especially during peaks), backups and people-time for maintenance. In OpenSearch you pay not only for volume but also because indices like memory and fast I/O. Loki often has cheaper storage (especially with object storage), but complex queries and high parallelism still need resources.
A cheap disk can become expensive if it slows things down. Switching to HDD may lower price per TB but slower read/write can require more nodes to survive peaks, increasing the final bill and causing more incidents for the team to troubleshoot.
People often forget to budget for 2–3x log growth per year, peaks (release, incident, mass retries), replicas (often x2 storage) and space for rebuilding data after failures. Add backups, restore tests (not just a checkbox) and temporary files for compaction. Lastly, there’s the cost of time: if searches are slow an engineer spends hours instead of minutes.
It’s useful to think in simple terms: price per TB per month at the chosen retention. Multiply average daily volume by retention days, add buffer for growth and peaks (e.g., +50%), then multiply by replication factor. That gives how many terabytes you actually pay for. Then compare two scenarios: more cheap storage with heavier searches or less but faster storage where queries don’t force cluster expansion.
Operations in a small team: where it will hurt
With 2–5 people on infrastructure, the main question isn’t "what’s faster" but "what won’t wake us at night." Tools are chosen for features, but the winner is the option that’s simplest to keep healthy without a dedicated SRE.
What usually eats time
Pain arrives not on day one but after 2–4 weeks, when logs grow and product tasks remain. Time is mostly spent on upgrades and version compatibility (agents, storage, UI), retention and disk fill control, backups and recovery checks, alerts and triaging false positives. A separate category is incidents when "search finds nothing" though the problem existed.
OpenSearch usually has more operational tasks: cluster state, shards, index health, capacity planning. It’s familiar to those who used Elasticsearch. Loki is often simpler for storage but demands label discipline: if the team starts using labels for everything, cardinality and cost spike.
Practices you can’t skip
A small team should agree on minimal rules up front, or the system will slowly "fall apart."
Monitor the logging system itself: ingestion delay, write errors, disk fill, query latency. Control growth: volume limits, clear retention for prod and stage, and regular reviews. Enforce access separation: who sees everything, who sees only their services, where secrets are stored. And have a runbook for failures: what to do on disk full, storage unavailability or node outage.
Agree on log formats: consistent fields (service, env, trace_id) so searches don’t become guessing games. Simple examples: someone added user_id as a Loki label and cardinality exploded; or OpenSearch had too detailed indexing enabled and the cluster spent CPU on segments. These issues are rarely visible immediately, so a short guideline and one place to check logging health daily help a lot.
How to choose: a step-by-step plan for the team
Start not with tool names but with how people actually search and read logs. Then the choice becomes hypothesis testing rather than a style argument.
Gather the team for 30 minutes and follow these steps:
- Write down 3–5 most common queries: by service, by error, by user, by incident time. Clarify if you need aggregations and reports (e.g., top errors per day) or mostly "find a specific trace."
- Define retention and acceptable ingestion delay: 7 days or 90, do you need near-real-time logs, is 5–10 minute delay acceptable?
- Fix format and minimum fields. Usually timestamp, level (info/warn/error), service, environment (prod/stage), trace_id or request_id and message text suffice.
- Run a pilot on real data for 7–14 days: same volume, same sources, same production queries.
- Summarize results in a table: storage cost and growth, speed of typical queries, hours per week spent on maintenance (upgrades, retention, alerts, indexing issues).
Also lock down logging rules: who owns structure, naming conventions, what not to log (secrets, personal data), and how to check log quality before a release. One short document often helps more than switching systems.
Common mistakes and traps
The most common problem is trying to collect all logs and keep them "just in case." In production people enable maximum verbosity, don’t set volume limits and don’t filter noise (health checks, noisy libraries, frequent 404). A week later space runs out and searching that sea becomes harder.
Second trap is lack of naming rules for fields and labels. In Loki this shows as a label "explosion" (too many unique values); in OpenSearch it’s schema chaos where the same event is described differently across services. The result is the same: queries don’t match data and people start "reading raw strings."
Retention is often chosen arbitrarily: "let’s keep 90 days." Without estimating daily volume, compression, replication and disk types this is a gamble. Especially dangerous if conclusions are based on currently small volumes.
Another risky trap is "everyone has access to everything." Logs can contain usernames, tokens, addresses and error details. Without roles, masking and rules the leak risk rises sharply. For regulated organizations this becomes a blocker.
Finally, a tiny-volume pilot gives a false sense that "everything flies." At 5 GB/day searches are fast, but at 200–500 GB/day you may suddenly lack disk, memory and maintenance time.
Quick checklist that often saves you:
- Limit logging levels in prod and cut out noisy sources.
- Agree on consistent field names and mandatory labels (service, environment, version).
- Calculate storage from facts: GB/day x retention x replication, then choose disks.
- Set up role-based access per team and environment.
- Test scaling on data similar to "six months from now," not just "today."
Short checklist before deciding
To avoid taste-based debates, spend 20 minutes answering a few questions.
First agree on numbers: current daily log volume and growth for 3–6 months. A typical mistake is using a one-week average and ignoring peaks (releases, incidents, seasonality). Peaks often determine disk types and node counts.
Then specify retention rules. Split logs by type and retention: application logs can often be shorter, while audit and security logs kept longer. Different retention windows are easier to manage and price.
Check what you search for daily. List the top queries (at least 10) and mark which must be fast. Usually these include searching errors by service and time, filtering by user or order, trace-id lookup, incident investigation across fields and period sampling for reports.
Record reliability requirements: what if log search is unavailable for 1 hour and how long you can wait for recovery after a failure.
And the last practical item: who will be on call for the system. Assign an owner and realistically estimate weekly time for updates, disk space, retention, backups and alert handling. If the answer is "almost no one," pick the option with less manual work in your reality.
Realistic example: a small team and log growth
An 8-person team supports 6 services: two monoliths on VMs and four containerized services. Releases happen 2–3 times a week; the main pain is quickly finding errors right after deployment. Incidents requiring a day or two of event reconstruction are rarer.
There’s no dedicated platform engineer. Developers rotate on-call. Budget for disks is limited, so keeping everything for months "as is" isn’t possible. The team starts with 30-day retention and will revisit.
For a fair comparison they run a pilot on identical input. They take the same sources (API logs, worker logs, DB proxies, ingress) and run the same queries: "errors in the last 15 minutes," "all events for request_id," "5xx spikes after release." Agree in advance what counts as "search time": from query input to a clear answer, not just engine throughput.
Success criteria are simple:
- response time for 3–5 typical queries during peak hours
- storage cost for 30 days at real volume (including replication)
- weekly manual operations (rotations, alerts, failures, upgrades)
- how easy it is for a newcomer to find what they need (query templates, clear fields)
- how the system behaves if volume doubles without major rework
Often the result is: Loki is simpler to maintain and cheaper on disks if you mainly filter by labels and time. OpenSearch wins when you need text-like searches across many fields, but you pay with indices, resources and more complex operations.
Next steps: pilot, infrastructure and support
After comparison don’t rush to pick a "winner." Narrow to 2–3 clear architecture options and discuss them with those who will operate and fix incidents. In practice the debate is usually decided by how you search and who will maintain the system.
Before starting the pilot, fix success criteria. Otherwise after two weeks everyone measures "convenience" differently and the data don’t align.
Mini-pilot: what to test
Make the pilot short but honest: 7–14 days, real logs, real load. Pick one critical service and one noisy service to see extremes.
Test:
- response time for 3–5 typical queries (errors by code, trace-id search, latency spike)
- storage cost: daily usage and projection for 30–90 days
- reliability: what happens when an agent or node fails and how quickly ingestion recovers
- operational tasks: upgrades, backups, rotation, who does what
- security and access: role separation by team and environment
Infrastructure and support
Plan disk and memory headroom for growth: logs almost always increase faster than expected. If logging affects production, separate resources for storage and search from business services. For these tasks rack servers like GSE S200 Series are often used so compute isn’t shared with applications and capacity is easier to plan.
If you’re in Kazakhstan and need predictable supply and service, consider discussing a local hardware and integration option from GSE.kz. This can be convenient when you want hardware, deployment and ongoing operations covered and the team has little time for manual assembly and night incident handling.
Final step — assign responsibilities: who owns the logging platform, who manages access, and who decides after the pilot, with a specific date.
FAQ
When does it make sense to choose between Loki and OpenSearch, instead of using "whatever"?
Compare them when logs grow large and searches start taking minutes, or disk space runs out unexpectedly. At small volumes both systems seem convenient, but as you scale the differences in storage costs and maintenance effort become obvious.
Which is usually cheaper on disk: Loki or OpenSearch?
By default Loki is usually cheaper for storage because it focuses on compressed chunks and a small label index. OpenSearch typically requires more disk due to indices and metadata, but can win on complex searches and analytics across many fields.
What will be faster in real tasks: finding an error by trace-id and viewing surrounding events?
If you frequently search across many fields and want fast point queries with a good mapping, OpenSearch is generally faster. If you mostly filter first by service, environment and time and then search within a narrow set of logs, Loki works fine and is often cheaper.
What data should be defined in advance: labels for Loki or fields for OpenSearch?
For Loki, well-thought-out labels are key: they must quickly narrow the stream to the right service and environment without exploding the number of unique values. For OpenSearch, identify key fields (e.g. trace_id, user_id, status_code) and index them; otherwise you’ll be searching full text and lose speed.
Which labels in Loki most often cause problems?
Don't make labels out of values that are almost always unique, like request_id, user_id or full URLs — cardinality will explode and the system will become expensive to operate. Keep labels to things that group streams well: service, env, cluster, namespace; leave unique identifiers in the message or structured fields.
Where to start calculations: with disk choice or with retention?
Start with retention, because it affects cost and operational risk the most. Measure daily volume, add a buffer for growth and spikes, account for replication, and only then choose disks and cluster size.
Why did search suddenly become slow even though it was fine yesterday?
Usually it’s due to too-broad queries without time limits or source filters, not a "bad" system. First narrow the time window, then filter by service/env (or indexed fields), and only then run a text search.
What metrics and alerts are needed to prevent the logging system from breaking unexpectedly?
At minimum monitor ingestion latency, write errors, disk or bucket fill level, and query latency. If these metrics are not checked daily, issues are often found only after space runs out or search becomes unreliable.
How to organize safe access to logs to avoid leaks?
By default ban secrets and personal data from logs and configure role-based access by team and environment. Also have clear rules on what to log in production to avoid collecting unnecessary sensitive information.
How to run a fair Loki vs OpenSearch pilot and avoid misleading results?
Run a pilot on real logs for 7–14 days and test identical scenarios: post-release errors, search by trace-id, 5xx spikes, and investigating a one-day incident. Record not only response times but also manual work required for updates, retention and incident investigation — for a small team this often decides the choice.