Monitoring IPMI and Redfish with Prometheus: alerts and dashboards
Hardware monitoring via IPMI and Redfish in Prometheus without licenses: exporter architecture, temperature and power alert rules, and a minimal dashboard set.
Why monitor hardware and how we measure success
Most incidents start with hardware, not applications. A server’s temperature can rise because filters are clogged, a fan can lose RPM, one PSU can fail while the other works near capacity. At the OS level this is often visible too late or not visible at all — until the server reboots or starts throttling.
IPMI and Redfish are useful because they expose telemetry directly from the BMC without paid agents or licenses. This matters when you have many servers, a uniform fleet, import‑substitution requirements, or cannot install software on hosts. Exporters read sensors, and Prometheus with Alertmanager turns that into metrics, rules and notifications.
Success here is not the number of graphs but how quickly and calmly the team responds. A minimal working result looks like:
- metrics for temperature, fans and power arrive reliably and are clearly labeled;
- alerts fire appropriately and include a hint of what to check;
- there are basic dashboards for on‑call shifts and incident investigation;
- notifications reach the right people and don’t get lost at night.
Typical roles: an admin manages Prometheus, exporters and access; a data center engineer owns racks, cooling and power; security defines safe BMC access; the on‑call team receives alerts and performs initial checks.
A simple scenario: one server loses a PSU in a rack, load on the second rises, and internal temperature increases by 8–10 °C. If an alert arrives immediately, the PSU can be replaced before service stops. This is relevant for standard rack servers and for locally produced platforms like GSE S200, where it’s convenient to confirm a cause via sensor data rather than guess from symptoms.
What IPMI and Redfish provide in practice
IPMI and Redfish usually read data from the BMC (the server management controller), not from the OS. That’s convenient: metrics are available even when the server is hung, powered off, or hasn’t booted yet. Therefore BMC monitoring often becomes a foundational layer for hardware control.
IPMI provides a basic set of sensors available almost everywhere: zone temperatures (CPU, inlet air, chassis), fan RPMs, voltages and PSU statuses, sometimes current and power draw. There are also simple states — is the chassis open, overheat flags, or hardware events.
Redfish is a modern API where data is structured more clearly: separate entities for chassis, power supplies, fans, drives, NICs, inventory fields (serials, models), events and logs. It’s useful when you need context: which exact PSU failed, in which slot, and which chassis it belongs to. On newer platforms Redfish often covers more than IPMI.
In practice raw data is reduced to a few groups of metrics: temperatures, fans, power (PSU presence, input voltage, OK/Fail status), overall health statuses and component event counters or signs of new hardware errors.
Account for limitations in advance. Different vendors and even firmware versions may name the same sensor differently, and some sensors can be empty or "noisy" (for example, an inlet temperature sensor near the rack door). Before writing alerts, check which sensors are stable on your models (including in a mixed fleet) and mark noisy sensors as exceptions.
License‑free architecture: assembling the whole picture
The architecture is usually simple: Prometheus scrapes IPMI exporter and/or Redfish exporter, Alertmanager routes alerts, Grafana visualizes everything.
Minimum components:
- IPMI exporter (polls BMC via IPMI)
- Redfish exporter (polls BMC via Redfish/HTTPS)
- Prometheus (collection and storage)
- Alertmanager (alert routing)
- Grafana (dashboards)
Where to run exporters depends on the network. If BMCs are reachable from the monitoring zone, run exporters close to Prometheus: easier updates and debugging. If BMCs live in a separate management network with strict access, it’s better to run exporters near that network (for example, on a node in the management VLAN) to avoid opening extra paths.
Networks should be strictly separated: production (service) networks must not access management (BMC). Usually allow exactly one route from monitoring to BMC on required ports. A common setup: a monitoring node with two interfaces — one in the Prometheus/Grafana zone and one in management — and only that node polls BMCs.
If BMCs are not directly reachable from the monitoring zone, use an intermediate point: a jump host or small proxy that polls BMCs and exposes metrics from one address. For example, place a proxy in the management network in a rack (including racks with GSE S200 servers), and have Prometheus scrape that proxy. This preserves isolation while maintaining visibility into temperature, fans and power.
Step‑by‑step start: from zero to first metrics
Start by choosing a source. IPMI is convenient for quickly getting temperatures, fans and power from nearly any server. Redfish usually gives cleaner and more consistent data on newer hardware and is better for unifying collection across modern platforms. In practice a hybrid approach is common: Redfish as primary, IPMI as a fallback.
Before installing exporters, gather a short BMC inventory: address, server model, read‑only account, network segment. If there are racks with GSE S200 Series, note rack and role (storage, compute, mgmt) so you don’t have to guess later in dashboards.
Next, take small steps:
- run IPMI and/or Redfish exporter next to Prometheus to quickly debug access;
- verify on 2–3 servers that you see basic metrics: temperatures, fan speeds, PSU state;
- add a Prometheus scrape job and set labels: site, rack, role;
- choose a reasonable interval (for example 30–60 seconds) and ensure polling doesn’t overload BMCs;
- after successful checks, expand the target list to the full fleet.
If metrics don’t appear, the issue is usually the management network, the BMC account, or the interface being disabled on some servers — not Prometheus. Achieve stable data on a few nodes before scaling.
Metric normalization: keep alerts from being noisy
The main problem with hardware metrics is that the same meaning appears under different names and in different units. Without consistent naming, labels and filtering, you’ll quickly get false positives.
Start with units. Keep temperature in degrees Celsius, voltage in V, power in W, fan speed in RPM. If an exporter reports tenths or milliwatts, correct that with recording rules so alerts and dashboards behave consistently across models.
Then decide on sensor names. IPMI often yields variants like "CPU Temp", "CPU1_T", "Processor 1". Redfish may show "CPU1" or "CPU.Socket.1". A practical approach: create a mapping dictionary and normalize into simple categories (cpu, inlet, exhaust, vrm, psu) plus an ordinal.
Labels help pinpoint rack and service quickly. A minimal set: dc (site), rack, host, role (db/app/vdi), service (team or business service).
Filter out trash sensors: disconnected (state: unavailable), constant zeros, sensors without units, exact duplicates. A good rule: only sensors that were valid for at least N minutes in the last day should feed alerts.
Set thresholds by role. A dense GPU rack will have different inlet thresholds than a file server. If unsure, start with static thresholds and add a baseline comparison (for example p95 over 7 days plus a margin).
For power normalize three things: PSU status (ok/fail), input power and redundancy. If redundancy is lost, that alert should be separate and higher priority than increased consumption. "AC fail" is its own incident class and should not be mixed with a single PSU failure.
Minimal alerts for temperature, fans and power
The minimal alert set should catch real failures and not wake people for second‑long spikes. It’s useful to have two levels: warning (check) and critical (act now).
Temperature: warning vs critical and spike protection
Temperature often spikes under short loads or aggressive fan curves. Use a firing delay (for) and two thresholds: warning and critical.
- alert: HostTempHighWarning
  expr: (max_over_time(node_hwmon_temp_celsius[5m]) > 75)
  for: 10m
  labels: {severity: "warning"}
  annotations:
    summary: "High temperature (warning)"

- alert: HostTempHighCritical
  expr: (max_over_time(node_hwmon_temp_celsius[2m]) > 85)
  for: 3m
  labels: {severity: "critical"}
  annotations:
    summary: "High temperature (critical)"
A useful degradation signal is when temperature increases under normal load. This alert need not be critical but helps find clogged filters or rack cooling issues.
- alert: HostTempRising
  expr: (predict_linear(node_hwmon_temp_celsius[30m], 30*60) - node_hwmon_temp_celsius) > 8
  for: 20m
  labels: {severity: "warning"}
  annotations:
    summary: "Temperature rising faster than usual"
Fans and power: distinguish "sensor missing" from real failure
For fans distinguish three situations: sensor disappeared (often after BMC reboot), a fan stopped, or RPMs are consistently below norm. For power, common events are a single PSU failing, loss of redundancy, or loss of input power on a feed.
Routing notifications by importance helps:
- warning: on‑call engineer (check during business hours)
- critical: on‑call + duty roster (immediate)
- "sensor unavailable": separate channel so it doesn’t hide real failures
In racks with GSE servers, these alerts usually reveal a common pattern: one PSU off, redundancy lost, and temperature rising before users complain.
Alertmanager tuning: less noise, more value
Once metrics are in Prometheus, the frequent problem is an avalanche of notifications. Alertmanager’s goal is one clear incident instead of dozens of similar messages.
Agree on grouping. If multiple devices in a rack warm up (for example after an AC fault), one alert for "rack A2" is more useful than 40 server alerts. group_by on rack, dc and alertname is usually enough.
Deduplication relies on Prometheus sending identical alerts and Alertmanager merging them. Practically this means set reasonable group_wait and group_interval, and use a longer repeat_interval (for example a few hours) so on‑call does not see the same alert every 5 minutes.
Use Silences for maintenance. Planned PSU swaps or BMC firmware upgrades should not wake people at night. Silences usually target instance, rack or service.
Alert text solves half the problem. In alert annotations include a short auto‑comment: server and location (rack/row), sensor and current value, threshold and severity, and a hint (for example, "check fans/PSU/inlet temperature").
Test in controlled conditions: temporarily lower a temperature threshold, disconnect one PSU on a test server, verify one grouped notification arrives and that it can be muted with a silence.
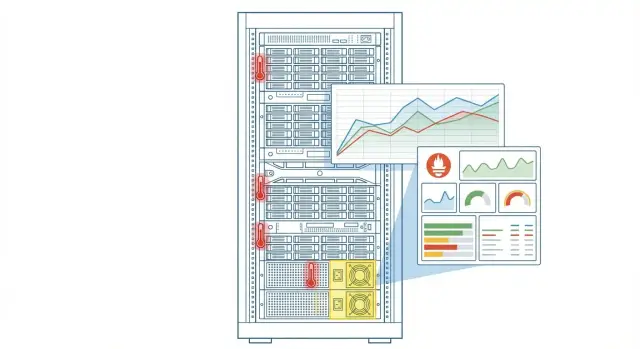
Minimal Grafana dashboards (5)
Starting small, you need answers to two questions: what is broken now, and where is it getting hot or unstable. Five dashboards usually cover most needs.
-
Overview of the fleet (health). Tiles with counts of servers in OK, warning, critical by rules: temperature, fans, power, sensors in error. A table of top problem hosts.
-
Rack heatmap. A matrix showing the maximum temperature per server (CPU, inlet, system). Add a trend for the hottest server to catch cooling degradation early.
-
Power and redundancy. PSU status, N+1 loss and input power/consumption if sensors provide it.
-
Fans and airflow. List of non‑OK fans plus RPM time series for key nodes. Often you’ll see a fan’s RPM drift long before full failure.
-
BMC and exporter availability. Panels for up/scrapes, scrape durations and errors. This helps distinguish real hardware faults from network/BMC/unavailable exporter problems.
For usability, use shared variables and grouping: site, rack, host, model; consistent warning/critical thresholds; clear markers for "no data" vs "sensor error"; alert annotations; and an explicit source label (IPMI vs Redfish).
Security and access: don’t turn BMC into an attack vector
BMC (IPMI/Redfish) is separate from the OS and can be forgotten: unpatched, exposed, or with lax access. For monitoring this is convenient, but from a security standpoint it’s one of the riskiest interfaces on a server.
Credentials: who knows passwords and how to rotate them
Principle: BMC access should be limited to a small circle and use service accounts, not personal logins.
Practical minimum:
- store passwords in a secret vault, not in Prometheus configs or env vars;
- use a read‑only user if possible;
- rotate passwords on schedule and after personnel changes;
- disable or rename default accounts;
- maintain a mapping of which BMC account corresponds to which server pool.
Network and protocols: lock down BMC access
Ideal: BMCs are on a separate management network and only the monitoring node (and admin jump hosts when needed) can access them. Use firewall rules or ACLs to only allow monitoring IPs to BMC ports. Block everything else.
Enable TLS for Redfish where supported. If some models don’t support proper TLS or have broken firmware, don’t force a single profile across all hardware. Split configs by hardware type (different Prometheus jobs or exporter settings) and record exceptions as temporary with a review date.
Logs for incident investigation
Log not only alerts but the quality of polling: timeouts, auth errors, latency spikes, and rising counts of unreachable BMCs. Example: if multiple Redfish timeouts appear in a rack with GSE S200 servers, it’s often not "everything broke" but an overloaded management switch or an ACL issue. Exporter logs and scrape metrics will show that quickly.
Common mistakes and pitfalls when rolling out
The most common issue is polling BMC too frequently. Once it seems logical to collect every minute, many controllers start responding slower, time out, or temporarily block requests. The result: ragged graphs and alerts triggered by collection issues rather than hardware faults.
Another trap is one‑size‑fits‑all thresholds. Temperatures depend on model, firmware, rack position and load. A server at the top of the rack or in a hot aisle can be 5–10 °C hotter and still be normal. Start with base thresholds but allow exceptions by role or rack (for example dense S200 racks in a zone).
Alerts without delay and grouping quickly become an alarm clock. Fans can briefly spike, a power sensor may glitch, the management network can drop for a second. If you wake people for every such event, trust in monitoring erodes.
Before launch check minimums:
- a reasonable BMC poll interval (often 2–5 minutes is enough);
- alert delays (for example 5–10 minutes);
- alerts grouped by host/rack, not per sensor;
- self‑monitoring: Prometheus, exporters and management network are monitored;
- clear responsibility split: hardware vs applications.
Another common failure is mixing hardware and application alerts in one channel without a clear owner. Then a PSU issue is looked at by developers and a service outage by hardware teams. Separate channels or at least clear Alertmanager routing labels fix this.
Quick checks before production
Before production it’s more important that the system is useful at 3 a.m. than that metrics exist. These checks take 30–60 minutes but often save days of post‑incident work.
Readiness checklist
Check five items that fail most often at first launch:
- BMC inventory is up to date: unified list of hosts, credentials, network access and a process to add a new server the day it’s installed;
- three basic alert scenarios pass: overheating, PSU failure, BMC unavailability (not just the alert appearance but clear text and easy finding in Grafana);
- alert owner exists: who accepts at night, who confirms in the morning, what is considered normal (e.g., a brief spike during reboot);
- dashboards open quickly and filter by site, rack, role;
- there is a short document with thresholds and model exceptions.
How to run tests quickly
For PSU failure use a test server with redundancy and carefully unplug one PSU for a minute. An alert should arrive and the dashboard should show the server and rack.
Test BMC unavailability by temporarily blocking access from monitoring or disabling the management interface, then restoring it. For temperature tests temporarily lower the alert threshold for 10–15 minutes, confirm firing, and revert.
If servers are in multiple sites (for example different cities in Kazakhstan), ensure site and rack tags are filled consistently. Otherwise filters and alert routing will confuse on‑call.
Practical example: PSU failure and rising rack temperature
A rack has 10 servers, each with dual PSUs (A/B) and BMC via IPMI or Redfish. One day PSU on server N7 fails, but the server stays up on the second supply. After 40–60 minutes rack temperature rises because one PDU feed and cable harness carries extra load, and some fans spin up.
The first signal is usually not temperature but power: an alert about lost redundancy. Instead of "PSU redundancy: OK" it becomes "Degraded" or one power_supply_status disappears.
Later a second alert appears: temperature warning. Often inlet temperature or CPU temp warning fires on multiple servers at once. This hints at a rack‑level issue rather than a single host.
The on‑call follows a short playbook: open the power dashboard to see which feed lost A/B; check the rack heatmap to see if one server or several are heating; compare inlet and internal sensors; and check fan speeds (a group RPM spike usually means intake air warmed up).
If only one host turns red, it’s likely that host’s PSU, fan or heat sink. If inlet and fan speed rise across multiple devices, investigate power distribution, airflow (blocked blanks, obstructed intake), room temperature or overloaded PDU.
Actions: replace the PSU (restore "redundancy: OK"), check cable routing and airflow, verify temperature returned to normal and alerts closed by themselves rather than being manually silenced.
Next steps: moving to stable operations
Once initial alerts work, the goal is to make monitoring helpful daily and not distracting. This means coverage, sensible thresholds and clear runbooks.
Expand sources to quiet failures: disks (SMART), RAID controller status and SEL events (BMC event log). SEL is especially useful when a server rebooted itself or power was lost and the OS shows little trace.
Move from individual servers to racks and zones. Mass degradation (6–10 servers rising temp or dropping voltage) should be a single incident, not ten identical messages. This points faster to cooling, PDU or room supply issues.
Finalize thresholds and responses with those who will act: data center ops and security. The same threshold may be normal for different models, and certain actions (like BMC access) must be strictly regulated.
A practical minimum in a runbook:
- who acknowledges alerts and within what time;
- actions for overheating, fan failure, PSU issues;
- when to move to emergency mode (reduce load, power down);
- what data to attach to a ticket (graph, SEL events, server model).
When building or refreshing a server fleet, bake BMC monitoring in from the start: dedicated management network, role‑based accounts, unified export templates for IPMI/Redfish and alert tests before commissioning.
For projects in Kazakhstan it’s often convenient to do this at delivery and integration: for example, when deploying GSE.kz S200 Series, agree on the BMC access scheme and include monitoring setup in the rollout to avoid retroactive fixes in production.
FAQ
When should you bother with hardware monitoring via BMC?
If you want to catch overheating, fan failure or PSU issues earlier than the OS or users notice. A useful criterion is: the alert comes in time and immediately suggests what to check, not just adds another graph.
Which to choose: IPMI or Redfish?
IPMI is simpler and often works "almost everywhere": temperatures, fans, power. Redfish usually provides clearer structure and more context (which exact PSU, slot, device) and fits newer platforms better. In practice a good approach is Redfish as primary, IPMI as fallback.
Why is BMC monitoring often more reliable than OS metrics?
Because BMC lives independently from the OS. When a server hangs, hasn't booted yet, or is powered off, OS metrics may be unavailable. BMC keeps reporting, so you can see temperatures, power and statuses even when you can’t SSH in.
Which hardware metrics should be collected first?
Start with temperatures by zones, fan statuses and RPM, and power supply status and redundancy. This set is enough to catch most real issues: clogged filters, cooling degradation, PSU failure and loss of N+1.
Where is it best to run IPMI/Redfish exporter?
Place exporters where they can safely and reliably reach BMC: either next to Prometheus or on a node inside the management network. The important part is that there is a minimal necessary route to BMC and production networks have no direct access to management interfaces.
How to tell you are not overloading BMC with too frequent scrapes?
Start with 30–60s interval only for a couple of servers for debugging, then move to a gentler interval if you see timeouts or increased latency. A good sign is stable scraping without error spikes and BMCs not “thinking” under monitoring load.
How to make temperature and fan alerts not noisy?
Use a firing delay (for) and separate warning and critical thresholds so short spikes don’t wake people up. Also keep a separate signal for “sensor/source unavailable” so it doesn’t mask real incidents and become constant noise.
Why normalize metrics and labels if something is already showing?
First convert units to one standard (°C, RPM, W, V), otherwise thresholds behave unpredictably. Then normalize sensor names and add clear labels like site and rack so the on-call immediately sees where and what failed instead of hunting by raw sensor names.
How to configure Alertmanager so it won't spam on-call staff?
Group alerts by rack or host so that a common issue (e.g., rack cooling) produces one clear message instead of dozens. Deduplication and a longer repeat_interval prevent receiving the same notification every few minutes; silences cover planned work so people are not woken at night.
What quick tests to run before production?
Test three scenarios: one PSU failure, BMC becoming unavailable, and a temperature alert triggered by temporarily lowering the threshold. If you have identical racks, ensure rack/role labels are consistently filled so routing and dashboards behave correctly.