Factory IoT Telemetry Collection: Network, Segmentation, Storage
Factory IoT telemetry collection: how to design the network, separate OT and IT, and configure storage so you don't overload corporate infrastructure.
Where overload usually begins
It almost always starts with a good idea: add more sensors and "collect everything" to see the full picture in real time. But a pilot quickly becomes a continuous 24/7 stream that gradually consumes links, servers and storage.
Overload is more often caused not by one "fat" source but by hundreds of small ones: polling once per second instead of once per minute, duplicated messages, overly detailed logs, and retransmissions on poor links. Add cameras, software updates, office traffic and backups — and the network starts to "choke".
Typical symptoms look like this:
- corporate systems experience higher latency; reports and email freeze
- links between sites or workshops occasionally saturate
- log and alert volumes grow while useful signals do not
- monitoring servers and databases constantly hit disk or memory limits
Telemetry's purpose should not harm the main thing — stable production and safety. If data collection affects operator workstations, accounting systems or even access to controllers, the project becomes seen as a risk.
The boundary usually runs between OT and corporate IT. OT values predictability and change control; IT values speed of deployment and flexibility. When these zones are mixed without rules (for example, sensors and controllers talking directly to office servers), overloads and incidents are only a matter of time. Then you need a simple network diagram, segmentation and clear rules about where data is processed and stored.
What data to collect so you don't bloat the stream
Overload starts not with the network but with the desire to collect everything. First connect data to use cases: what should trigger action on the shop floor, and what IT actually needs for reports and maintenance.
Common sources are always the same: sensors (temperature, vibration, pressure), PLCs, CNC machines, energy and water meters, ventilation, compressors. Useful parameters are almost always fewer than available ones. A frequent mistake is taking high‑frequency raw values while the task can be solved with statuses, events and occasional samples.
A practical approach is to choose a transmission mode for each parameter:
- emergency and control signals — event‑driven (state change, alarm), not continuous stream
- fast processes — 1 second or faster only where it affects product quality or safety
- slow metrics (shop temperature, tank level, airflow) — usually 30–60 seconds is enough
- energy metering — typically 1–5 minutes, plus events on big spikes
- diagnostics — short high‑frequency "windows" on schedule or when a problem appears
Example: for compressors, pressure, temperature and run state are important. Poll pressure every 5 seconds, temperature every minute, and send run state as an event. The picture stays useful but traffic remains under control.
Don't forget minimal metadata, otherwise data turns into noise: precise time, stable point identifier (machine, line, sensor) and a quality flag (OK, no connection, doubtful). This helps filter bad readings and avoids inflating storage with duplicates.
Basic network layout for factory telemetry
To prevent telemetry from bringing down the corporate network, break the architecture into levels and don't make sensors direct "guests" of the office infrastructure. Simple schemes usually beat complex ones if boundaries are clear.
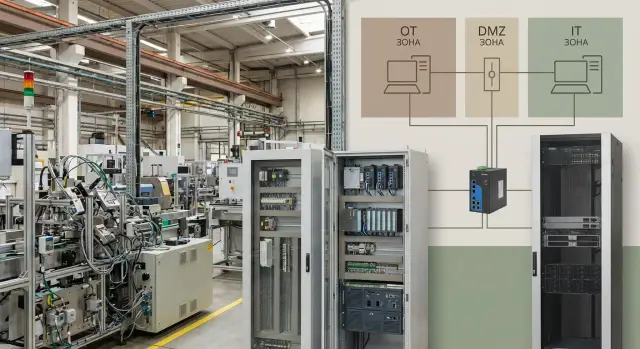
A convenient way is to think in four layers:
- equipment and controllers (sensors, PLCs, machines) in the OT network
- area gateways (collection and initial processing)
- an exchange zone (OT‑DMZ, intermediate zone between OT and IT)
- corporate systems (analytics, ERP, storage) in the IT network
The boundary is where you stop trusting a device "by default." OT follows availability and predictability rules; IT follows rapid change and flexibility. Direct connections from PLCs and sensors to IT usually create extra traffic, complex routes and increased incident risk.
Assign component roles in advance. OT performs collection "as is" (often with specific protocols and addressing). A gateway normalizes data, converts it to a common format and decides what to send immediately and what to buffer. The OT‑DMZ handles routing and access control. IT provides long‑term storage and the services that read data.
On factories you often see Modbus, OPC UA, Profinet, EtherNet/IP; for upward transport teams choose MQTT or HTTPS. A unified collection layer is needed so the protocol "zoo" does not spread across the company.
The fewer end devices that "see" the corporate network, the easier it is to manage load. Compute and buffering should be placed closer to the shop floor, while IT receives a cleaned stream. For exchange and server areas, reliable on‑prem servers are commonly used so storage and processing depend less on link quality between sites (for example rack servers of the GSE S200 family for continuous loads).
OT and IT segmentation: a simple plan without excess
If telemetry is attached to the general corporate network, problems appear quickly: broadcast traffic, scans, updates and accidental loops can affect controllers and lines. Segmentation is needed not for aesthetics but to prevent an IT outage or overload from affecting OT (and vice versa).
Start with minimally clear zones:
- OT level: PLCs, machines, sensors, HMIs and everything that controls the process
- area (cell) level: devices of a specific line or workshop
- OT‑DMZ: where data exits OT into IT
- IT level: servers, analytics, office services
- contractor contour: temporary access, laptops, service connections
Simple techniques are enough: VLANs and subnets. In practice, a separate VLAN per line or workshop plus a VLAN for the OT‑DMZ usually works. Keep streams separate: telemetry, control and service access should use different routes. That makes it easier to find fault causes and limit consequences.
OT‑DMZ provides one controlled gateway between worlds. Receivers and intermediary components are placed there. IT servers no longer need direct access to PLCs, and OT is not exposed to office scans and policies.
Keep inter‑network rules to a "least privilege" principle. Practical minimum:
- OT to OT‑DMZ — only outbound connections to needed ports (e.g., broker/receiver)
- IT to OT‑DMZ — data and admin access only from limited addresses
- IT to OT direct — deny by default; exceptions only by procedure and temporarily
- logging and monitoring — separate access so the real traffic picture is visible
Example: a packaging line sends telemetry to a service in the OT‑DMZ; from there data goes to corporate storage. If the office network is noisy or a noisy device is connected, the line keeps working because the critical OT network is isolated.
Plan for contractors separately. Don't let them plug into an OT switch like into a wall outlet. Usually a separate Wi‑Fi or a dedicated port/switch in the contractor contour is enough, access only via VPN/bastion to specific equipment, named accounts with expiration, and prohibition of cross‑access between IT and OT without explicit rules.
Gateways and edge processing so the network doesn't drown
Most failures are caused not by the sensor or the server but by the network between them. An IoT gateway helps by doing work near the equipment: ingesting different protocols, normalizing format and producing a predictable outgoing stream.
A gateway typically:
- collects signals from controllers, sensors and meters
- filters noise (repeats, empty values, contact bounce)
- normalizes units and tags (names, time, quality)
- separates data by importance and frequency
- secures the channel (authentication, encryption, integrity checks)
The key technique is edge buffering. Links between shop floor and IT can go down for minutes or hours due to work, failures or overload. If a gateway stores telemetry locally (disk/SD/SSD) and catches up after recovery, you keep history and avoid a packet storm when the network returns.
Edge processing is not "for cleverness" but to save traffic. For example, instead of sending vibration at 1 kHz to a central store, the gateway computes 1–5 second windows (average, peak, RMS) and sends aggregates. Raw data can be kept locally and uploaded on events (threshold exceeded, alarm, investigation).
Separate streams: operational metrics (for dispatch and alerts) are frequent and small; archival data (for reports and analytics) is sent less often, larger and possibly delayed.
Placement rule is simple: close to the source where power, connectivity and access for maintenance exist. This can be the automation cabinet at the line, a small shop floor rack or a local server room. Compact industrial PCs or local servers suit these nodes, including domestically produced models when procurement and support require it.
Telemetry storage: retention, tiers and volumes
Storing all telemetry "as is" for years overloads not only the network but also storage, backups and analytics. Decide in advance two things: what must be available immediately and what can be archived, and how long each class must be kept.
Hot and cold data
Hot data is needed by the dispatcher and shift engineer: current values, alarms and trends for the last hours or days. Keep it in fast storage with frequent updates and fast queries.
Cold data is history for investigations, reports, audits and optimization. Store it cheaper: compress more, access less often, and sometimes keep only aggregates.
Retention: store not "forever" but "as needed"
Retention is the rule of how much and in what form to keep. One sensor is not an issue; thousands at 1 Hz are.
A working approach is to classify telemetry by criticality and assign retention depths. For example:
- process parameters (quality, safety): raw 7–30 days, aggregates 1–3 years
- energy metering: hourly/daily 3–5 years (accounting requirements), raw short term
- equipment service metrics (temperatures, fans, SMART): raw 14–90 days, aggregates 1 year
- events and alarms: keep longer than ordinary points because they are used for root cause analysis
Compression reduces size without losing meaning; deduplication removes repeats (e.g., identical statuses); downsampling thins points while preserving trend shape (store minute averages instead of 1 Hz points).
Where to store: on site or corporate datacenter
If the link to the DC is unstable or autonomy is important, primary storage stays on site and aggregates/events go to the DC. With a good channel you can centralize, but always keep a local buffer for hours or days.
Example: a packaging line writes 2,000 tags once per second. Keep raw data on a local server for 14 days for operations, then send only minute aggregates to the DC. For these tasks teams often install a dedicated server node on site; integrators like GSE.kz provide servers and solutions for round‑the‑clock loads.
How to manage load and scale
Industrial telemetry load is rarely uniform. The shop is active by day, maintenance by night, and during an incident dozens of sensors increase sending frequency. If you accept everything unchanged, the network or database falls first while sensors are still fine.
A simple combo usually helps: queues plus batching. Data from devices or gateways is queued, then pulled in small portions on a schedule. This smooths peaks; one spike does not flood a channel or disk.
Queues, limits and fairness between workshops
Decide in advance who can consume how much resource. Otherwise one area with extra sensors or faster polling starts interfering with everyone.
Practical minimums:
- message‑per‑second limits per device and per area (with temporary increase for incidents)
- separate queues by area or data type (alarms separate from background)
- maximum packet size and send frequency (for example, every 1–5 seconds)
- degradation rule: under overload preserve alarms, reduce or delay less important data
Example: if the packaging area suddenly starts sending telemetry five times faster due to misconfiguration, limits and a separate queue keep the issue contained locally and prevent a plant‑wide outage.
Monitoring and growth plan
Monitor not only "is it working" but how close you are to limits: link utilization, CPU on gateways and servers, disk write rates, queue depth, delivery latency (sensor to storage). These metrics quickly show what bottleneck appears first.
If sensor count doubles, start with cheap steps: reduce useless measurement frequency, enable edge aggregation and increase buffers. If you hit server limits, separate roles (ingest, processing, storage) and add compute and disks. In practice separate servers for telemetry are used so load does not compete with office systems — for example rack solutions like the GSE S200 Series.
Plan updates and maintenance in windows: update one node or one gateway first, check queues and latency, then continue. Collection does not stop because buffers and queues survive short pauses.
Telemetry security without overkill
Security in industrial telemetry can easily become a brake: too many passwords, blanket bans and manual approvals. A practical rule is simple: protect points that can affect production or leak valuable data, and keep the rest convenient and predictable.
Accounts and permissions
Separate who writes and who reads. Sensors, PLCs and gateways should only be allowed to send telemetry, not read other streams or change storage settings. A shift engineer usually only needs to read latest values and alarms; analysts and IT need history and exports.
Use separate service accounts for equipment and for people with minimal rights. Compromise of one sensor then won't give keys to the whole system.
Encryption and secure channels
Encrypt where telemetry leaves the shop network: to the corporate segment, datacenter or remote monitoring. Inside a short local path (sensor to gateway in the same cabinet) stability and simplicity may matter more, especially for weak devices. A compromise: secure the channel from gateway to broker/storage, and keep lightweight protocols at the very edge.
Inventory solves half the problems. You must know what is connected, which switch or cabinet it belongs to, firmware versions, owner and last maintenance. This helps quickly locate a noisy sensor suddenly sending ten times more messages.
Event logs are not "just in case" — they help find incident causes. Log device connects/disconnects, auth errors, gateway config changes, queue growth and manual data exports. A common scenario: network didn't fail but a gateway buffer overflowed and an hour of history was lost — without logs it looks like data disappeared on its own.
Isolation must be clear. Separate OT and IT at least by routing and access rules: devices don't need a direct path to office resources. But don't create dozens of tiny zones if nobody can manage them. Better 2–3 clear segments (shop floor, collection/gateways, corporate services) with solid rules than a perfect scheme that breaks at first line expansion.
Step‑by‑step rollout without stopping production
Start with a short, precise statement: who needs telemetry and why. The shop needs clear alarms and equipment trends, IT needs network and server stability, security needs defined exchange points between OT and IT.
Then move in steps to avoid touching running lines unnecessarily:
- Define data use cases. Example: dispatcher needs overheating and downtime alerts; reliability engineer needs vibration; IT needs gateway and channel load.
- Inventory sources and estimate future flow. Count not only sensors but PLCs, drives, meters and SCADA. Estimate poll rate, message size and point counts.
- Draw network zones and agree exchange points. Separate OT areas, gateway zone (OT‑DMZ) and IT zone with storage and analytics. Decide where firewalls sit and which protocols are allowed.
- Choose gateways and enable filtering with buffering. Keep only needed metrics at the edge, set frequencies, add a local queue so data is not lost and does not create traffic spikes on link recovery.
- Configure storage and retention before the pilot. Check how much space data takes daily, monthly and yearly. Storage tiers help: raw short‑term on site, minute/hour aggregates for long term.
Start a pilot on one area with minimal risk but real value — for example a line with frequent stops: collect temperature, vibration and energy, tune alarm thresholds and verify OT network remains stable.
When the pilot is stable, replicate using templates: uniform zone settings, standard sensor profiles and consistent retention rules. If you need a separate on‑site storage node, plan server capacity in advance (for example rack servers for industrial IoT like the GSE S200) so you can scale without redesign.
Common mistakes and how to avoid them
A frequent reason telemetry interferes with the business network is building the system to "quickly see all charts" rather than as a managed data flow. The result is lots of packets, little value and unexpected outages.
Mistake 1: "The faster the polling, the better"
Polling at 1 Hz looks nice but is unnecessary for many metrics. Ask: what will you do if a parameter changes? For a bearing temperature 10–30 seconds may be enough; alarms must be immediate.
Rule of thumb: increase frequency only where it triggers action (stop, alert, control), not just "for history."
Mistake 2: Mixing OT and IT without an exchange zone
When office systems access controllers directly, any scan or error can hit production. Use a clear exchange: collect in OT, transfer to a buffer/gateway, then to IT. This reduces risk and keeps traffic manageable.
Alongside this basic change you often find poor device management: identical passwords, no inventory, unknown models and firmware. Fixing this starts with inventory and proper accounts rather than new software.
A typical remedy: set polling frequencies by criticality, separate OT and IT with an OT‑DMZ, keep a device registry and unique credentials, enable edge buffering, and set retention and disk fill monitoring.
Example: at a welding area the link to the central server is unstable. If a gateway writes to a local buffer for 4–12 hours, data is not lost and the network does not storm with retries.
Another mistake is running a pilot without success criteria. Before starting, record 3–5 measurable goals: acceptable latency, loss percentage, peak channel load, retention depth for raw and aggregated data. Then scaling decisions become obvious: how many gateways, how much storage and what servers are needed.
Pre‑launch checklist, short example and next steps
Before the pilot document a few items — it takes an hour but saves weeks of discussion and night work.
Mini‑checklist before turning on the stream
Gather the ICS engineer, security and IT and confirm everyone shares the same architecture and responsibilities:
- OT, OT‑DMZ and IT segments are documented; routes and exchange rules agreed
- gateways have limits and queues (buffers) to avoid burst floods on link failure
- retention is defined: what stays hot, what moves to archive and growth estimates for 6–12 months
- access roles set: who sees raw data, who sees reports, who can change poll settings
- logging enabled: user actions, config changes, delivery errors and missed samples
Short example
One workshop with 200 sensors. 120 sensors for vibration and temperature polled at 1 Hz, 80 sensors for meters and states polled every 30 seconds. Sending everything directly to the corporate network produces noticeable peaks at shift changes, equipment restarts and link failures.
Practical approach: a local gateway collects data, removes extra fields, compresses packets and keeps a buffer for several hours. An OT‑DMZ broker accepts a steady stream and forwards data to storage and analytics in the IT segment.
Next steps
Usually three actions are enough: define target metrics (flow, latency, loss) and run a one‑week pilot on one area; choose servers for storage and processing based on retention and growth; agree support (monitoring, update procedures and 24/7 response) so changes do not halt production.
If you need an on‑prem contour and integration, involve teams that cover infrastructure and support. For example, GSE.kz (gse.kz) as a manufacturer and system integrator in Kazakhstan provides servers and carries out integration for industrial loads with ongoing support.
FAQ
What typically starts network overload caused by telemetry?
Overload usually starts with "small" decisions: polling too often (once per second instead of once per minute), duplicated messages, excessive logs and repeated retransmissions when the link is poor. Together, hundreds of sources create a constant 24/7 stream that quietly fills channels, disks and databases.
Which data should be collected first to avoid inflating the stream?
Focus on actions, not curiosity: collect what affects safety, quality and maintenance, and what is actually used in reports. For many tasks events, statuses and occasional samples are enough instead of continuous high-frequency raw values.
How to choose sensor polling frequency without losing usefulness?
By default, use event-driven transmission for alarms and states, 30–60 seconds for slow parameters and 1–5 minutes for energy metering; enable high frequency only where it affects decisions. For diagnostics, prefer short high-frequency windows on a schedule or when a problem is suspected.
What metadata is mandatory so telemetry doesn't turn into garbage?
A minimal set is: precise timestamp, stable point identifier (line/machine/sensor) and a quality flag (normal, no connection, suspicious). Without these you get noise, duplicates and harder investigations; storage swells because of incorrect or repeated records.
What basic network layout works best for factory telemetry?
Divide the system into levels: OT equipment and controllers, site gateways, an OT‑DMZ exchange zone and corporate IT systems. This keeps sensors and PLCs from becoming "guests" on the office network and lets IT receive an already cleaned, predictable stream.
Why shouldn't PLCs and sensors be connected directly to the corporate IT network?
Because OT and IT follow different rules: OT requires predictability and minimal changes, while IT has frequent updates, scans and noisy traffic. Direct connections increase incident and overload risk, so data should exit OT via a controlled exchange point in an OT‑DMZ.
Why is an IoT gateway needed and what should it do to keep the network from falling over?
A gateway collects data from different industrial protocols, filters repeats and noise, normalizes tags and decides what to send frequently and what rarely. The most important feature is a local buffer: if the link breaks, data is stored locally and sent later, avoiding a network "storm".
How to set up telemetry storage and retention correctly to avoid filling disks?
First separate "hot" data for dispatchers and shift engineers (current values, alarms, recent trends) from "cold" history for investigations and reports. Keep raw values only short-term and store aggregates (minute/hourly) for longer periods so backups and analytics are not overwhelmed.
What to do if telemetry grows and load peaks start appearing?
Queues plus batching usually help: incoming data is queued, then consumed in small batches on a schedule. This smooths peaks so a single spike won't saturate a channel or disk. Add per-device and per-area limits, separate queues for alarms and background data, and a degradation rule to preserve alarms while reducing non‑critical traffic.
How to manage load and fairness between different workshop areas?
Decide who may consume what resources in advance. Without limits one area with many sensors or too‑frequent polling will affect everyone. Practical minimums: message-per-second limits per device and per area (with temporary increases for incidents), separate queues by area/type, max packet size and send frequency, and a degradation policy under overload.
How to implement telemetry collection step by step without stopping production?
Start with clear goals and a pilot on a low‑risk area: define scenarios for the workshop and IT, estimate the expected stream, map OT/OT‑DMZ/IT zones and enable edge filtering with buffering. A common mistake is polling "as fast as possible" and sending everything into the corporate network; instead set frequencies, boundaries and retention first and then roll out by template.