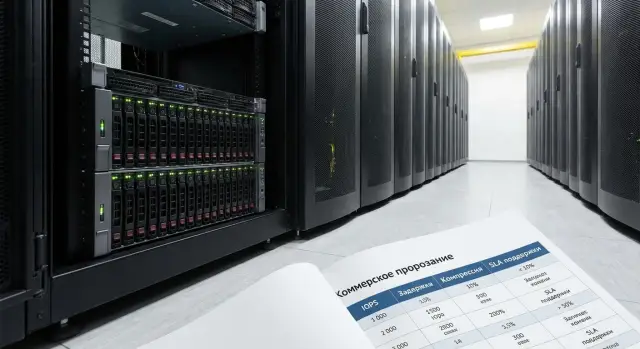
HPE Alletra 6000 all‑flash storage: how to compare quotes by the numbers
How to compare HPE Alletra 6000 all‑flash storage in commercial quotes: guaranteed performance, compression, support and hidden assumptions.
Goal: compare quotes by facts, not by flashy numbers
When you request several commercial proposals for the same all‑flash storage (for example, HPE Alletra 6000), a straight “head‑to‑head” comparison almost always fails. One vendor advertises “millions of IOPS,” another promises “minimal latency,” a third emphasizes “4:1 capacity savings.” Behind these numbers lie different assumptions: block size, workload type, shelf composition, whether snapshots and replication are included, which SSDs, how many controllers, what network.
The problem isn’t that the numbers are "false." The problem is that they often don’t answer your real question: how will the service behave in production? “Peak IOPS” in a short test are not the same as stable 24/7 operation. “0.2 ms latency” without conditions (queue depth, read/write mix, pool fullness, enabled features) is nearly useless. “Effective capacity” is often calculated on an optimistic data profile, without accounting for growth and overhead.
A critical service is more than “important.” It’s a service where failure or degradation immediately hits money, security or availability: databases, payments, EHR, government registries, virtualization of core systems. For such workloads, repeatable, predictable behavior under normal and stress conditions matters more than record peaks.
Before comparing quotes, agree the ground rules. Usually it’s enough to specify:
- working latency (average and p95/p99), not only “minimum”;
- sustained performance (tens of minutes to hours), not burst results;
- I/O profile: read/write ratio, block size, random/sequential mix;
- conditions: pool fullness, enabled features (snapshots, replication, encryption);
- resilience criteria and recovery time.
Then the task is straightforward: normalize all proposals to the same conditions and ask vendors to confirm figures under those conditions, not “in the lab.” That is how system integration typically works: unified requirements first, measurable answers second.
What you are actually buying: a short note on all‑flash class and Alletra 6000
All‑flash storage is a system where data resides on SSDs, without “slow” HDDs in the active pool. The easiest analogy: a road without traffic lights — lower latency, more predictable response, easier handling of load spikes. In hybrid systems some data sits on HDDs, and in practice you often hit latency and dropouts under complex scenarios rather than raw peak IOPS.
HPE Alletra 6000 as an all‑flash class is typically chosen where consistent response matters more than average throughput: virtualization (VMware/Hyper‑V), databases, business systems (ERP/CRM), and critical services with many small operations. If services are latency‑sensitive (database + application + many users), all‑flash usually delivers predictable results without intricate cache tuning.
To compare quotes correctly, agree what is included beyond disks. In a typical configuration, these are critical:
- controllers and resiliency scheme (dual controllers, failover/rebuild options);
- network ports and connection type (Ethernet or Fibre Channel), per‑controller speeds and counts;
- data services: snapshots, replication, encryption, QoS, hypervisor integration;
- licensing: what’s included and what costs extra when you grow or add features;
- monitoring: how latency and load are measured and whether reports support SLA verification.
Three constraints are worth clarifying up front to avoid comparing the incomparable.
First — protocols: which your hosts need (FC, iSCSI, NFS/SMB, NVMe‑oF) and what the chosen configuration supports.
Second — network and compatibility with your topology: often the limit is not throughput but port counts and redundancy (two switches, two paths, MPIO).
Third — scalability: how the system grows (shelves, controllers, upgrades) and whether support model and costs change as you scale.
Practical example: you have a virtualization cluster and a separate critical database. Two quotes show identical capacity, but one is limited by ports or protocol. Then any “performance guarantee” will be unattainable in your topology, even if the numbers look good on paper.
Performance metrics: what you can realistically compare
Proposals for all‑flash arrays often display impressive figures. For critical services, predictability and operating boundaries matter more than records.
IOPS are useful for small‑block workloads (often databases). But IOPS without context say almost nothing: the same array behaves differently on 4K vs 64K blocks, at 70% read vs 50% write, and with different queue depths. Only compare IOPS measured under the same workload profile.
Latency is the key metric for applications and users. Ask not only for the mean, but at minimum p95 and preferably p99. The mean can look “nice” while the system experiences noticeable pauses once in a while. Those rare peaks create transaction queues and user stalls.
Throughput (GB/s) matters more than IOPS when data moves in streams: backups, analytics, VDI, file services. Here, test conditions are mandatory: block size, write share, number of streams.
Also evaluate stability under increased load. A good array keeps latency within tight bounds as pressure increases rather than “falling off a cliff.” For Alletra 6000 and any competitor, ask for numbers that can be directly compared without reinterpretation.
To make comparisons fair, proposals should match on:
- workload profile (block size, read/write ratio, queue depth);
- latency target like p95 (better p99) and measurement conditions;
- IOPS and GB/s for the same profile;
- test duration and warm‑up (not “first 30 seconds”);
- testbed composition (controllers, disks, network, protocol).
Simple example: two proposals claim 200k IOPS. Vendor A shows p99 latency 1.2 ms, Vendor B 8 ms at the same 30% writes. On paper IOPS are equal, but Vendor B will cause stalls for databases and application queues in production.
How to verify “guaranteed performance” in a quote
“Guaranteed performance” sounds convincing but often hides conditions unlike your reality. The customer’s aim is to make all proposals answer the same scenario.
First, the quote must state the workload profile used to obtain IOPS and latency. Without it, comparison is meaningless: 200,000 IOPS on 4K and 70/30 read/write is not the same as 200,000 IOPS on 8K and 50/50. And sequential read almost always looks better than random write.
Next, clarify the conditions for the claimed numbers. Performance usually drops when the system is filled, data protection is enabled and the production resilience scheme runs. If one proposal quotes numbers for an empty system with no overheads and another for 70–80% utilization and enabled protection, you’re comparing different modes.
Ask to include the following uniformly in every quote:
- Profile: block size, read/write mix, random or sequential workload.
- Conditions: pool fullness, enabled data protection, RAID/erasure coding.
- Latency threshold: is there a promise like “latency not above X ms” or only IOPS?
- Units and configuration: results tied to a specific controller set, number of SSDs and network.
Mini‑scenario: two quotes for the same model show equal IOPS. In the first, latency is reported as “average” without SLA and at 20% fullness. In the second, latency threshold is specified at 80% fullness and with protection enabled. For critical services the second is more valuable because it’s closer to what you’ll see in production.
A good sign is a vendor willing to lock the workload profile and test conditions directly in the quote. That is usually more important than any peak number.
Compression and deduplication: how to compare without 4:1 illusions
“4:1” almost always describes an ideal case. In a quote, separate raw physical capacity (how many SSDs are installed) from effective capacity (how much data they promise after savings). Compare effective TB only under identical assumptions; otherwise it becomes advertising.
Ask the vendor to list which mechanisms were included in the calculation (dedupe, compression, thin provisioning) and how snapshots and clones were accounted for. A common trap: snapshots look “nearly free” but under active change they consume noticeable space.
Which assumptions should be disclosed
Have the vendor briefly describe the data used to derive the claimed savings. Usually it’s enough to state:
- workload type (VDI, databases, virtualization, files, backups);
- share of unique blocks (data repeatability);
- file types (office docs, images, video, archives);
- average block/page size if relevant;
- daily change volume (for snapshot sizing).
If you compare Alletra 6000 with alternatives, request a format like: “raw capacity → overheads → expected customer data savings.” That shows which part is calculation and which is assumption.
Performance matters more than a pretty ratio
Data reduction is not free. Quotes should include latency and IOPS/throughput with data reduction enabled, not only “clean” numbers. Again, for critical services p95/p99 is more important than averages.
Don’t forget overheads: reserve for RAID/erasure coding, metadata, system needs and rebuild spare. Example: virtualization for 200 VMs claims 4:1 but data are unique and actual ratio is 1.5:1. If reserve for protection and snapshot growth is missing, usable capacity will be lower than planned and you’ll hit capacity risk rather than SSD limits — increasing downtime risk for critical services.
Support policy and SLA: what must be written in the quote
For critical services, support often matters more than small IOPS differences. Ask for measurable commitments rather than “premium service.”
SLA should be verifiable. Minimum items to see on paper:
- support hours: 8x5 or 24/7, and what counts as business hours;
- response time and recovery time: separate for critical and non‑critical incidents;
- onsite and replacement: engineer arrival window, replacement time, advance replacement terms if promised;
- software updates: patches and upgrades included, who performs them, maintenance windows and rollback procedures;
- spare parts: where stocked, delivery to your city, handling in case of shortages or logistics delays.
Then check the incident handling process. It’s not only “15 minute response” but who takes responsibility: a single contact or two (vendor and integrator), escalation path, remote diagnostics, who gathers logs and who decides on component replacement.
Also request lifecycle information: supported OS/firmware versions, EOS/EOL policy, and what happens in 2–3 years if you need an upgrade. Will SLA level stay the same? Will components become “availability on request”?
Example: a bank in Almaty has critical payments. A quote stating “24/7” without recovery time and regional parts delivery risks a day of downtime. A more reassuring document specifies a single dispatcher, remote diagnostics within the first hour, onsite arrival within 4 hours and same‑day controller replacement if local stock exists.
Step‑by‑step method to compare quotes: one template for all vendors
To compare quotes for HPE Alletra 6000 all‑flash storage and alternatives sensibly, remove flashy numbers from the center of the discussion. Create one template and ask everyone to fill it under identical conditions. Differences then become obvious without argument.
Template in 5 steps
-
Gather service inputs as simple numbers. How many VMs or DBs, average and peak IOPS, required latency, current data and growth, maintenance windows. Note “bad days”: month‑end, close of period, morning logins.
-
Normalize each quote into a single view. The table should show: controller set, SSD type and capacity, shelf(s), usable capacity, RAID/EC, snapshots/replication, ports and speeds, licenses and limits.
-
Normalize performance to one profile. Fix block size (e.g., 8K), read/write mix (70/30 or your ratio), queue depth, number of volumes, whether snapshots/replication are enabled. If there’s a “guarantee,” ask for the conditions and what happens if they are not met.
-
Compare support using a “03:00 failure” scenario. Who accepts the ticket, how fast is the response, how soon will an engineer arrive, are spare parts local, and what counts as recovery — simply bringing the array online or restoring target performance?
-
Calculate TCO for 3–5 years. Include support, adding capacity and ports, upgrades, power and — most importantly — downtime cost. The cheaper initial quote often becomes more expensive due to risk and support costs.
Practice: if two quotes promise identical effective capacity via compression, ask for calculations on your data profile and a statement of latency and IOPS with dedupe enabled. That quickly separates real calculations from assumptions.
Common mistakes when choosing all‑flash storage from quotes
The main mistake is comparing unlike conditions. Then the vendor with the biggest numbers wins, not the vendor who honestly describes operating modes and limits. Problems usually show as unexpected latency, lack of capacity or disputes over support.
Mistakes in performance and capacity numbers
-
Comparing peak IOPS without checking latency and workload profile. For critical services you need IOPS achievable at target latency (e.g., 1–2 ms) and under a specified block size, read/write ratio and queue depth.
-
Believing effective capacity without assumptions. The number may rely on thin provisioning, dedupe and compression on ideal data. If the quote lacks data types and applicability limits, it’s worthless to compare.
-
Ignoring that features change the picture. Replication, encryption, snapshots and background tasks can reduce performance and increase capacity consumption. The quote must state whether numbers are given with features enabled.
To catch these mistakes quickly, ask each vendor for calculations on a single profile, e.g. “80/20 read/write, 8K, target latency up to 1 ms, snapshots and encryption enabled.” Then comparisons between Alletra 6000 and alternatives will be realistic.
Mistakes in infrastructure and support
Network is often forgotten and later you “suddenly” lack ports or redundancy. Ensure quotes explicitly state required ports and speeds on storage and server sides, switches/fiber/patch panels and licenses, redundancy scheme (2 switches, 2 paths, MPIO), and any compatibility limits (FC/iSCSI, OS and hypervisor versions).
Another common error is mixing vendor warranty, support and integrator obligations under one “all‑inclusive” line. Separate these items: list SLA (response and recovery), maintenance windows, who accepts 24/7 calls and what is excluded (for example, application or network work). Fewer ambiguous clauses means fewer disputes.
Short checklist: 6 checks before deciding
Before comparing quotes for HPE Alletra 6000 all‑flash and alternatives, set identical rules. Otherwise you’ll compare test scenarios, not systems.
Five checks that most often change the outcome:
- Workload profile is the same: block size (4K/8K/64K), read/write ratio, random or sequential. If vendors use different profiles, IOPS and GB/s aren’t comparable.
- Latency shown beyond the average: request p95 or p99 and measurement conditions (queue, streams, enabled features). Peaks matter for critical services.
- Performance tied to a specific configuration: which controllers, how many disks, network and protocol, and whether snapshots/replication are enabled. “Guaranteed” without hardware composition guarantees nothing.
- Effective capacity backed by assumptions: data types, expected dedupe/compression, share of unique blocks, encryption.
- Support spelled out: what’s included (software, firmware, part replacement, onsite), response and recovery times, 24/7 vs 8/5, and who performs the work.
Also ask for a list of exclusions and the process for agreeing configuration changes (adding disks, enabling encryption, changing versions).
Sixth check to protect the budget for 2–3 years ahead:
- Growth plan and expansion pricing: cost to add capacity and performance (controllers, licenses, shelves, ports) and lead times. A good quote answers this up front rather than “we’ll calculate later.”
If procurement is in Kazakhstan, it’s convenient for the integrator to lock these points in a single template and confirm them as attachments to the quote.
Example: comparing two quotes for critical services in practice
Imagine ERP on a database, a virtualization cluster for apps and terminal servers, plus file services. Data grows ~20% per year and downtime costs more than the difference between two arrays.
Start not with models and “up to X IOPS,” but with workload profile and a unified request template. Give vendors the same inputs and ask them to recalc configuration and guaranteed metrics for your workload.
Typical inputs for the first round:
- current and 3‑year data volume (with growth);
- share of random operations (e.g., 70% random) and read/write ratio (e.g., 60/40);
- target latency: separate for ERP (ms) and virtualization;
- peak multiplier at month/quarter ends;
- RTO/RPO and maintenance windows.
Now two quotes. Option A promises “4:1 compression” and looks cheaper per TB. Option B offers firmer support: fixed response, 24/7, guaranteed controller replacement and clear exclusions. Both use the same model, but compare numbers on your workload.
How to separate marketing from reality:
-
Ask Option A for capacity calculations in two modes: 1:1 (no reduction) and with claimed compression, plus assumptions (data type, duplicate ratio, encryption, snapshots). If assumptions don’t match reality, the ratio is irrelevant.
-
For performance, require numbers on your profile: IOPS, throughput, latency, and separate what happens during degradation (controller loss/rebuild).
-
For support, compare SLAs on paper: hours, response, recovery, parts delivery, local stock, exclusions.
If minimizing downtime is the priority, Option B often wins despite higher capacity cost: risks are more transparent and manageable. If budget is primary, Option A may work — only if compression is validated on your data and the quote states what happens at the worst‑case ratio (spare capacity and expansion cost).
Next steps: lock requirements and reduce risk
To keep quotes from turning into debates about “best technology,” write requirements as measurable numbers. Then every vendor answers the same questions.
Start with facts from your current system: collect metrics for a normal day and for a “bad” day when everyone complains. Capture peaks, not just averages.
What to collect per key volumes and services:
- latency (average and 95th percentile);
- peak IOPS and throughput;
- controller/port utilization and host queue depths;
- backup windows and heavy recurring jobs (ETL, reports, antivirus);
- data growth and 12–24 month forecast.
Convert business expectations into service SLAs, and SLAs into storage and support requirements. Example: “the clinic booking portal must respond < 200 ms” becomes “the database needs p95 latency ≤ X ms at Y IOPS, and incident recovery no longer than Z hours.” That is easier to verify in quotes and on a pilot.
Request a pilot on your profile and data. Synthetic tests often show pretty IOPS but don’t reflect mixed read/write small‑block latency.
In the pilot ask for:
- workload profile description (block, % read, queues) and how it’s reproduced;
- separate latency numbers (average and p95) not just IOPS;
- a report on compression/dedupe efficiency on your dataset;
- support conditions during the pilot: who’s responsible and response times.
If you need turnkey integration, fix single accountability up front: design, delivery, configuration, pilot, commissioning and support.
In Kazakhstan this is often easier via an integrator with its own service network. For example, GSE.kz (gse.kz) as a vendor and integrator can take responsibility for design, delivery and 24/7 support through a service network so that responsibilities don’t “slide” between hardware, configuration and operation.
FAQ
Why can’t two quotes for the same all‑flash storage be compared “as is” by the numbers?
Create a single comparison scenario and ask every vendor to respond within it: the same I/O profile, the same enabled features, the same percentage of pool utilization and the same resilience scheme. Then compare guaranteed latency and sustained performance, not the raw maximums.
Which workload parameters must be specified to make IOPS comparable?
Fix block size, read/write ratio, random or sequential access, queue depth and the host access protocol. Without these parameters, IOPS and GB/s are not comparable because any system can show flattering numbers on its preferred profile.
Which latency metric should I ask for in the quote: average, minimum, or p95/p99?
Target p95 and preferably p99 latency for your workload — those rare peaks are what cause queues and user-visible stalls. The average often looks good even when the system periodically produces noticeable drops.
What does “sustained performance” mean and how to verify it in a quote?
Request metrics measured in steady state after warm‑up, over at least tens of minutes — for critical services closer to an hour. Short bursts almost always overstate results and don’t show what will happen with background tasks and 24/7 operation.
Why is it important to specify pool utilization and enabled features when evaluating quoted figures?
Ask the vendor to provide numbers for a pool utilization close to production — for example 70–80% — and with the real features you will use enabled. Empty arrays without snapshots, replication or data protection almost always look better than they will in production.
How should I treat promises like “compression/dedupe 4:1”?
Separate raw SSD capacity (what is physically installed) and effective capacity (what is promised after data reduction). Then request the assumptions: workload type, expected block uniqueness, encryption impact and snapshot churn. Conservative planning uses 1:1 as a baseline and verifies additional savings on your data.
How can I tell whether compression will hurt production performance?
Ask for performance figures with deduplication and compression turned on, not just the clean numbers. If the vendor won’t commit to p95/p99 latency with data reduction enabled, there’s a risk performance will degrade after go‑live on your critical workloads.
What commonly breaks a performance guarantee besides the storage itself?
Make sure the quote documents the real connection topology: controller port counts and speeds, dual switches and dual paths, MPIO settings and host compatibility. Bottlenecks often appear in the network, not the storage, and then quoted IOPS are unreachable in your architecture.
What should be written in SLA and support to reduce downtime risk?
Require measurable commitments: 24/7 or 8x5 support, response time and separately recovery time, remote diagnostics, spare parts logistics and replacement rules. “24/7 support” without defined recovery times and parts delivery in your region offers little protection.
How quickly can I normalize quotes and choose an option without marketing claims?
Ask everyone to fill the same template that standardizes configuration, test conditions, latency and performance guarantees, capacity calculations with overheads, and the support/resilience scenario. Then compute TCO for 3–5 years including support, expansions and downtime costs — the cheaper initial quote often costs more once risks are included.