How to Lower PUE in a Data Center: Quick Measures Without Major Retrofit
How to reduce PUE in a data center without major retrofit: which metrics to track, quick measures that work and what you can start doing today.
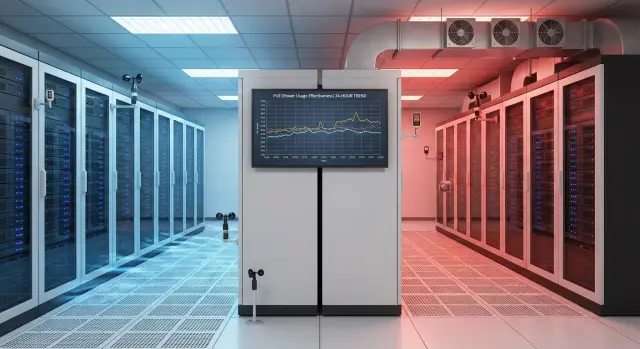
Why track PUE and a data center's energy use
PUE is a simple metric: how much energy the data center spends on infrastructure around IT compared to what goes to servers, storage and network. If PUE is 2, it means: for every 1 kW for IT you spend another 1 kW on cooling, power distribution and other "overhead." The higher the PUE, the more money and resources are spent not on useful work.
PUE often drifts up unnoticed. Racks were added but cooling setpoints remained conservative. Filters clogged and fans began running faster. Local hot spots appeared, and the whole room temperature was lowered even though the problem was localized. As a result, the power bill grows faster than the IT load.
Losses usually hide in three areas: cooling (wrong airflow, elevated fan speeds, excessive dehumidification), power (losses in UPS and distribution, low loading) and operating modes (equipment running "at maximum" when not required).
To actually lower PUE, separate IT load from infrastructure losses. Otherwise you can make wrong decisions — for example, buy more ACs while the real cause is mixing of cold and hot air.
Many improvements can be made without shutting down the site or major retrofits. Most often this is adjusting setpoints and cooling modes, fixing obvious air leaks and cleaning cable penetrations, checking losses in the power chain and enabling power‑saving modes on some servers where safe.
A real example: in a room with 20 racks it’s sometimes enough to block air leakage paths and raise the setpoint by 1–2°C to reduce cooling consumption in the first weeks.
Metrics to start measuring now
If the goal is to cut energy costs and keep PUE under control, start with measurements, not purchases. Even simple regular statistics quickly show where kilowatts are "leaking": in cooling, power, or inefficient IT.
It’s useful to calculate PUE in several slices. Hourly PUE helps catch peaks (e.g., excessive cooling at night because setpoints are too low). Daily PUE is convenient for comparing shifts and modes. Monthly PUE is needed for reporting and measuring impact, but it often hides short‑term problems.
Minimal set to collect:
- hourly and daily PUE (with meter readings recorded)
- IT load (kW) at least by halls, preferably by rack or PDU
- temperature and humidity at key supply and return points
- UPS load (%), conversion losses, power factor (PF)
- events and switches (UPS bypass, emergency modes, fan stops)
Temperature/humidity sensors are often not placed where decisions are made. Measure what the equipment sees, not the room average. Practical rule: at least one sensor for the cold aisle and one for the hot aisle, plus several in known problem spots.
Where to measure first: air inlet to a rack (top, middle, bottom), in the hot aisle at server exhaust level, at row ends (where recirculation and entrainment often occur), and near CRAC/CRAH units (supply and return).
If available, use pressure‑difference or airflow sensors as indicators of recirculation. A rise in inlet temperature at the same setpoints and IT load often means cold and hot streams are mixing.
Small example: a room with ~120 kW IT load had hourly PUE jumping from 1.6 to 2.0. Comparing UPS load and rack inlet temperatures showed excessive cooling at night and air entrainment at row ends by day. Without metrics these causes remain "gut feelings."
One‑day quick audit: step‑by‑step plan
The goal of a one‑day audit is to get an honest baseline: how much energy goes to IT, how much to supporting systems, and where losses are visible on inspection. This is a quick way to find how to lower PUE without downtime or rework.
Before you start, agree on a simple rule: that day we only measure and record, no improvements. Any changes are made after baseline figures are noted.
-
Read electrical meters and baseline IT load. Record total data‑center power, IT power (from UPS, PDU or server meters) and the time of measurement. If you have BMS/DCIM, export at least the last 24 hours.
-
Walk the hall and mark places where hot and cold air mix. Often these are open U‑spaces in racks, missing blanking panels, gaps under raised floor, or improvised cable cutouts.
-
Check cooling setpoints and fan modes. Record supply temperature, target humidity, whether an economy mode is enabled, and whether systems are conflicting (one cooling while another heats or over‑dehumidifies).
-
Assess rack utilization and "idle" servers. Note racks with low utilization, continuously idle nodes, and heat spots where server fans run near maximum.
-
Build a baseline and plan repeated measurements. A simple table is enough: date, PUE, IT‑kW, HVAC‑kW, supply temperature, complaints or incidents.
If you repeat measurements at the same weekday and hour, even small fixes become visible.
Airflow: simple sealing and separation measures
If you want results without rework, almost always start with air. Extra kilowatts usually come not from "bad ACs" but from mixing hot and cold air. When hot exhaust returns to server inlets, cooling must work harder.
Sealing: small gaps, big effect
The goal is simple: cold air must reach equipment, not bypass it. This is usually cheap and done on site.
Check basics: blanking panels in empty U slots, gaps around racks, doors and side panels, cable penetrations and openings under the raised floor. Remove objects in front of racks and perforated tiles that create dead zones. Also check for "reversed" devices: if some equipment pulls air from the hot aisle side, the whole rack will heat up.
A simple test helps: a tissue or thin ribbon on perforations shows where air is being drawn the wrong way. If you have a thermal camera, look for local hot spots specifically at rack inlets rather than room averages.
Separating hot and cold without rebuilds
Even without full containment, flows can be temporarily separated with screens, curtains or guide panels. The point is to make it harder for hot exhaust to return to equipment intakes.
Track three indicators to see the effect: rack inlet temperature (top and bottom), the inlet‑to‑outlet temperature difference (Delta T) and the share of racks with hot spots. After sealing, Delta T usually increases and you can cautiously raise cooling setpoints without risk.
Cooling settings: setpoints and modes without rework
Quick savings are often in settings, not hardware. If cooling runs "just in case," fans spin at high speed and humidification triggers unnecessarily, PUE rises even with normal IT load.
Temperature: raise it gradually and have a rollback plan
Increase setpoints stepwise, not in one jump. The goal is to remove overcooling where it brings no benefit.
- Raise supply setpoint by +1°C and hold for 48–72 hours.
- Monitor rack inlet temperatures (at least in problem rows) and server alarms.
- If persistent hot spots appear, revert one step and first fix airflow.
- Repeat until you reach the agreed reliability limit.
- Predefine a rollback threshold: e.g., inlet temperature rising above target range in two consecutive measurements.
A small setpoint increase often reduces fan and compressor consumption more than expected.
CRAC/CRAH modes: fan speeds and control logic
Check how fans are controlled: constant speed or based on sensors (supply temp, aisle pressure, rack inlet temp). Constant speed usually wastes kW 24/7.
See if units conflict: one overcools while another reheats or aggressively dehumidifies. That is a common source of hidden cost.
Agree humidity by a range, not a hard point. Too narrow humidity setpoints cause frequent humidify/dehumidify cycles and add load.
Check schedules. Night and weekend often remain in "day" mode even though IT load is lower. Even modest reductions in intensity during off‑peak hours bring noticeable savings.
To avoid cooling the whole room "for two racks," map hot spots. Walk rows with a thermal camera or portable sensors and mark the 3–5 racks with the highest inlet temperatures. Increase cooling locally (via airflow fixes and setpoint adjustments) rather than raising total capacity.
For change control, record at minimum: average and max rack inlet temperature, humidification duty cycle, fan power consumption and number of temperature alarms. This lets you safely iterate and rollback.
IT load: how to cut kW without losing service quality
Reducing IT consumption often gives a double benefit: fewer kW on servers and lower cooling and power losses.
First quick step — power settings at OS, hypervisor and BIOS where safe. In office VDI, test environments and some backend services you can enable CPU power‑saving profiles (dynamic frequency, C‑states) and limit turbo. Before mass rollout, test 2–3 typical services to avoid latency increases.
Next, hunt for "zombies." Almost every data center has VMs used once, forgotten test benches, long‑unused backup services and underutilized hosts. Watts are wasted there.
A week is usually enough for practical actions: list hosts and VMs with low CPU/memory utilization over 7–14 days, consolidate workloads onto fewer hosts, power down unused machines on a schedule (nights, weekends), cautiously apply power caps where SLA allows, and check whether background jobs (backups, indexing) create peaks. If one area is constantly hot, redistribute heavy services across racks rather than raising cooling for the whole room.
To avoid debates, measure at least: kW per rack and per cluster (time‑of‑day breakdown), average and 95th percentile CPU per host, share of powered off hosts and removed unused VMs, and rack inlet temperature by group.
Simple example: after consolidating two lightly loaded clusters into one and turning off 6–8 hosts nightly, power consumption drops immediately and cooling load follows.
If part of the fleet is old, it can be more effective to selectively replace the most power‑hungry servers (for virtualization or databases) than to expand cooling. Compare "watts per useful work" in your context: kW per VM, per transaction or per vCPU for a typical workload.
Power and distribution: quick steps to cut losses
Losses in the power chain are often invisible: IT load looks normal while extra kW hide in UPS, distribution and conversion.
First check UPS loading. At very low load (e.g., capacity reserved for growth but racks not yet added) efficiency usually drops and you pay constant losses. Look at actual UPS load per unit, not only the room summary.
Next — UPS operating modes. Many models offer higher efficiency modes when utility power is stable, but these must be aligned with quality and risk requirements. Evaluate UPS efficiency at your real morning, daytime and night loads.
A walk through distribution often finds issues: hot terminals, loose connections, phase imbalance, unevenly loaded lines. Sometimes visible in alarm logs or rising panel temperatures, sometimes only detectable with clamp meters.
Short weekly plan:
- record load and efficiency per UPS at 3–4 times of day
- check phase balance and redistribute single‑phase loads where applicable
- find hot connections (thermal camera or sensors) and fix causes
- remove redundant conversions where possible (double conversion chains, temporary extension cords)
- enable PDU or line‑level metering to see the most "expensive" racks
Example: some racks moved but UPS mapping didn’t change, leaving one UPS at low load. After redistributing racks across PDUs and moving some loads to another UPS, losses fell, phases balanced and cooling stopped chasing wasted heat from electrical panels.
Operational habits that stabilize PUE
PUE often fluctuates not due to equipment but due to small actions: someone changed a setpoint, opened a machine‑room door, removed a blanking panel and forgot it. To keep improvements, you need discipline: log changes, quickly spot deviations and prevent repeats.
Start a simple change log: date, what was changed (setpoint, mode, rack move, filter cleaning), who approved and what effect was seen on temperatures, power and PUE in the next 24–48 hours. Over a month the log saves time: you see which actions truly help and which are just nice ideas.
A short shift walk checklist is useful: leaks (doors, raised floor, cable penetrations), missing blanking panels, unusual noises or vibrations in fans and ACs, manual modes, odd sensor readings, obstructions to airflow and high‑density zone condition.
Then — placement rules. If a row has weak cooling spots, don’t place the hottest nodes there and don’t increase density without checking. In practice this is one line in a procedure and 10 minutes of approval before any move.
Also use alerts not only on temperature but on rising power or load so you don’t fight symptoms. Weekly short reviews help: what affected PUE (weather, load, logged changes) and what actions to repeat.
Example scenario: improvements in 2 weeks without downtime
Context: a small room with 24 racks, mixed loads (virtualization, databases, a couple of GPU servers). Operations complained about overheating in two rows: hot at row end but cold at the hall entrance. No downtime allowed, only on‑the‑fly work.
Week 1: establish the baseline
First, agree what "before" and "after" mean. Over 3 days we collected baseline numbers: overall PUE from meters and UPS, temperature map by rows (rack inlet/outlet, top/middle/bottom), UPS load and phase distribution. This already showed some racks were entraining cold air and one UPS was operating at an inefficient load range.
Week 2: five non‑intrusive actions
We then did five simple things without dismantling or moving equipment:
- installed blanking panels in empty U slots and closed large cable penetration gaps
- raised supply setpoint by 1–2°C and smoothed fan control to remove sharp oscillations
- reorganized several "hot" servers inside racks (top to bottom) and cleared the front area
- balanced loads across PDUs and phases to even currents and reduce excess heating
- scheduled test benches and some dev environments to power down at night and weekends
Results were checked at the same points as the baseline and over at least a week to avoid weather or load spikes. Control criteria were simple: inlet temperature in problem racks, number of overheat warnings, mains power and average UPS load. PUE fell from 1.78 to 1.66 and the two hot rows cooled without increasing cooling power. This is the right logic: first remove air and control mode losses, then consider hardware upgrades.
Some tasks were deferred to a maintenance window: additional sensors, revisiting cold‑aisle layout and updating cooling control logic.
Common mistakes and traps when working with PUE
It’s easy to make PUE look good on a graph while not improving reality. PUE is an indicator, not the goal. Chasing PUE at any cost can increase the risk of overheating, failures and degraded equipment life.
One common mistake is abrupt cooling changes. Raising setpoints or cutting fan speeds by several degrees seems like a quick win. But without monitoring and rollback planning you’ll learn about problems last: when errors, throttling or disk failures start to appear.
Equally risky is focusing only on averages. Daily average PUE can improve while a single row becomes a local "oven" due to air leaks, blocked perforated tiles or reversed airflow. You save on fans and then lose on downtime.
Compare periods carefully. Winter often makes cooling look more efficient and you might think measures worked. Summer can reverse the picture. Compare results under similar conditions or at least record outside temperature and humidity.
Simple rules to avoid counting savings by eye:
- record IT load (IT kW) together with PUE
- log setpoints and equipment modes before changes
- monitor rack inlet temperatures, not just room temps
- make small steps and keep a "back" button
- note weather when comparing weeks
Example: a team raised the setpoint by 2°C and saw PUE improve. A week later a cluster began throttling in the evenings. Investigation showed the room average was fine but a hot zone formed around two racks due to missing blanking panels and cable gaps. After sealing, they returned setpoints to a safe range and achieved stable savings without service impact.
Short checklist and next steps
If you want to lower PUE without capital investment, start with simple checks and make measurement a habit. Logic is the same: baseline first, then change one parameter and compare with the same metrics.
Short checklist for the next 1–3 days:
- capture the baseline: PUE and IT load (kW) for the last 7–30 days, mark weekends and peaks
- inspect air paths: blanking panels, cable penetration gaps, open panels, obstacles in front of perforated tiles
- check cooling: temperature setpoints, schedules (night/weekend), sensor correctness and placement (not in a cold jet)
- assess power: UPS loading, phase imbalances (if relevant), load distribution by rack and obvious hot spots
- assign an owner for metrics and agree on reporting rhythm: at minimum weekly with a short note of what changed and why
Next steps for 2 weeks: establish regular data collection (even manually), make 1–2 quick changes (e.g., sealing and setpoint adjustment) and compare to baseline. If data are sparse or measurements uncertain, external instrumented measurement or improved monitoring helps.
If you plan server, rack or infrastructure upgrades, such work is often done with a system integrator. For example, GSE.kz (gse.kz) provides system integration and data‑center infrastructure and also supplies servers and workstations of their own production, which is convenient when linking IT refresh with measurable energy reductions.