ERM Risk Management System: Register, Assessments, Response Plans, and KPIs
A practical guide to designing an ERM risk management system: registry fields, risk assessment and appetite, response plans, links to incidents, and KPIs.
Where to start: what ERM actually solves
ERM isn't meant to be just a "list of threats in a table." Its job is to make risks visible, comparable and manageable: which ones matter most, who owns them, what has already been done and where leadership decisions are needed.
A single list of risks almost always becomes outdated quickly. It lacks context (what the risk affects), status (what's happening now), an owner (who should act) and, most importantly, links to management decisions: what to change in processes, controls, budget and timelines.
Start from the result a leader needs. Usually it's not a "list of risks" but a short set of signals: which risks are top and how their levels change, where actions are overdue, which risks exceeded appetite and need escalation, which new incidents happened and how they change the picture.
Then set the boundaries for the first stage. It's better to start with risks you can realistically control and measure, and expand gradually. In organizations with critical IT services (government body, bank, clinic) it makes sense to begin with operational and IT risks: service outages, cyber threats, equipment supply failures, change errors.
For a pilot, use a simple inclusion rule: take 1–2 departments, 10–20 key processes and only those risks that have an owner and clear consequences (money, availability, safety, compliance). Add strategic and reputational topics later, once you have update and reporting discipline.
Roles, cycles and management levels
To prevent the system becoming a reporting spreadsheet, define roles, work rhythm and the management levels where risks are handled. That way every risk has an owner and management has a clear overview.
Roles: who is responsible for what
A risk card usually needs 3–4 roles, assigned by name:
- Risk owner — the leader who accepts the risk and decides what to do next.
- Responsible (executor) — maintains the risk in the system, gathers data and updates action status.
- Approver — checks assessments and plans (e.g., InfoSec, finance, legal, compliance).
- Observer — receives notifications and uses the data (PMO, quality, audit).
Separate owner and executor. For example, the risk of server infrastructure downtime may belong to the IT director, while the backup and testing actions are performed by the operations lead.
Cycles: how often to update
Too-frequent reviews are tiring; too-rare reviews make the register dead. A common working rhythm is:
- Monthly — quick review of statuses and overdue actions.
- Quarterly — re-evaluate probability and impact, check controls' relevance.
- Annually — plan initiatives, budget and targets for reducing key risks.
Levels and escalation rules
Keep risks at different layers: corporate, process, project, IT and InfoSec. Escalation is needed when a risk exceeds a team's remit: expected loss passes a limit, it affects multiple departments (e.g., production, integration, 24/7 support) or requires priority/budget decisions. In such cases the risk is raised to a risk committee, and for critical or public-impact risks — to the CEO.
Risk register structure: risk card fields
A risk card should be short and uniform for everyone. Comparability is more important than a “perfect description.”
Minimum set of fields
Start with what is necessary to find, assign and review a risk:
- Risk ID (unique and immutable) and a short title
- Simple description: what can happen and where
- Context: process, department, asset or service, geography, key counterparties
- Owners: risk owner and control owner (if a control exists)
- Next review date and status (active, closed, under review)
Then add causes and consequences, but keep them to 2–3 points. Cause answers "why this can happen," consequence — "what will hurt." Example: "storage array failure" (cause) and "downtime of a critical service for branches" (consequence).
Fields for filtering and reporting
To make the register useful in daily practice, include classification and tags:
- Category (financial, compliance, IT, HR, etc.)
- Type (strategic, operational, IT, project)
- Criticality or priority (for sorting)
- Related assets or services (consistent names from a reference list)
- Tags (e.g., "vendor", "data center", "public procurement") for quick selections
This format helps quickly assemble a report for a service or department without manual data cleaning.
Risk assessment: scales, matrix and appetite
To prevent assessments from becoming a collection of opinions, agree on common scales and calculation rules. The clearest option is 1–5 scales for probability and impact plus a matrix that converts scores into priority.
1–5 scales: how to describe them
Tie probability to frequency over a period (e.g., per year) rather than vague words like "rare":
- 1: almost impossible (once in 5+ years)
- 2: unlikely (once in 2–5 years)
- 3: possible (about once a year)
- 4: likely (several times a year)
- 5: almost certain (monthly or more often)
Record impact not as a single overall number but across measurable categories. Keep separate ratings for financial loss, downtime (SLA/hours), compliance (fines, breaches), reputation (public exposure) and safety (injuries, criticality).
Inherent and residual risk
Record two values: inherent risk (before controls) and residual (after current controls). A simple formula can be probability x impact. The point is not multiplication for its own sake but to see which controls truly reduce the score and why.
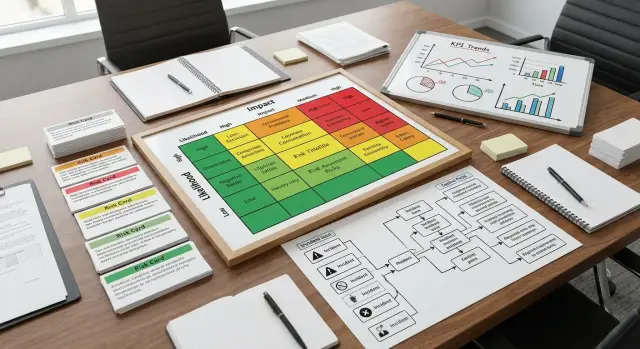
Risk appetite sets matrix thresholds and escalation rules. Often a traffic-light is used:
- Green: accept, controlled at the owner level
- Yellow: requires a response plan and review deadline
- Red: mandatory escalation and leadership decision
Document thresholds and approval authorities (process owner, risk committee, board) in the methodology.
To keep assessments stable, record assumptions and sources: incident data and metrics, audit results, vendor statistics or expert judgment with names and dates. This simplifies reviews and helps discuss disputed risks based on facts.
Controls and their link to risks
A control is a specific action or rule that reduces probability or impact. It's important to separate the risk (what can happen) from the control (what we do to prevent it or detect it quickly).
Divide controls by purpose: preventive (stop the problem from occurring), detective (detect deviations quickly) and corrective (reduce consequences and speed recovery).
To make controls checkable and improvable, include fields such as:
- ID and short unambiguous title
- Description: what it does and for which process
- Owner: responsible for execution
- Frequency: daily, weekly, event-driven
- Evidence of execution: what counts as confirmation
Risks and controls are almost always many-to-many. One control can reduce multiple risks (e.g., change management reduces downtime, security breaches and non-compliance). Conversely, a risk is usually covered by a set of controls: one prevents, another detects, a third helps recover.
Assess control effectiveness across several dimensions, otherwise the register becomes a formality: does the control cover the scenario (design), is it executed on schedule (execution), is there evidence (verifiability), and does it rely on a single person (resilience)?
Store artifacts, not just a checkbox: logs, monitoring reports, test reports, sampling checks, backup confirmations. Example: for a risk of critical service downtime, a detective control is the availability report for the month, and corrective control is the recovery test report with date, time and result.
Response plans: how to describe actions and responsibilities
A response plan turns a risk from a line item into clear tasks. It should read like a mini-project: what to do, who does it, when, and how we will know it improved the situation.
Choose a strategy first: avoid (remove the vulnerable process), reduce (add controls or change the process), transfer (insurance, contractor) or accept (intentionally keep with monitoring and limits). This prevents actions for the sake of actions.
A plan card usually includes:
- Actions: short steps tied to the root cause (not symptoms)
- Responsible: action owner and approver
- Deadlines and budget: date, effort, purchases, external contractors
- Expected effect: how probability or impact will change after completion
- Evidence: what to attach (act, test protocol, order, report) to accept the work
Also record dependencies and blockers: procurement, contractor readiness, change windows, InfoSec approvals, data access. If dependencies are not noted, plans almost always fail "suddenly."
Make completion criteria verifiable. "Backups configured" is weak. "Daily backups have run for 14 consecutive days, reports exist, and a restore was performed on a test bench" is good.
Statuses should be simple: planned, in progress, overdue, completed, canceled (with reason). If a task is canceled, state what replaced it or why the risk is now accepted.
Small example: the risk of downtime for a critical service due to a server node failure. The mitigation plan may include buying a spare node, configuring clustering and practicing recovery. Fix the expected effect beforehand so after completion it is clear the risk has actually decreased.
Link to incidents: keep the register alive
The register often "freezes" if it lives separately from real failures and losses. Therefore, record incidents and link them to risks, controls and owners.
An incident is an unwanted event that already happened and caused (or could have caused) harm: service outage, missed deadlines, equipment failure, data leak. An "event" can be a neutral observation (e.g., a brief load spike), while a "problem" is the confirmed root cause that must be fixed.
A practical link looks like this: an incident is tied to a specific risk (what materialized), to the control (what should have prevented or detected it) and to the risk owner (who is responsible for the fix). For example, if an integrator's critical system stopped in a data center, the incident is linked to the risk "downtime of a critical service," the control "monitoring and redundancy" and the service owner.
Keep only decision-useful fields in the incident card:
- Date/time, source (monitoring, user, audit)
- Impact: downtime, scope, direct damage and indirect losses
- Cause (preliminary and confirmed), what exactly failed
- Actions: immediate fixes and permanent corrections
- Lessons: what to change in controls and instructions
The work cycle should be short: register, investigate, corrective actions, verify effect, close and update the related risk.
Incidents must "move" the assessment: increase probability when repeated, clarify impact by facts, change plan priorities and control requirements. Then the register becomes a working map of where the company loses time and money.
Link to KPI and KRI: measurable signals instead of vague words
The system stops being a "table of dangers" when each risk has measurable signals and a clear trend. You need two groups of metrics: KRI (early risk indicators) and KPI (performance or execution indicators).
KRI answer "is the risk approaching?" They are set as thresholds and trends with a clear measurement frequency: daily for critical services, weekly for vulnerabilities, monthly for HR and financial factors. KRIs should be predictors, not after-the-fact reports.
A typical mapping: risk -> KRI (what rises before an event), control -> KPI for execution (are we performing the control on time), response plan -> KPI for progress (are we meeting deadlines and effect). Then the card shows not only an assessment but the "pulse."
Examples often used in IT and operations:
- SLA for critical services: share of time within SLA and mean time to restore (MTTR)
- Incident response time: median time to start work and share of incidents escalated per procedure
- Patches: percentage of systems updated on time and share of overdue critical vulnerabilities
- Backups: share of successful backups with regular restore verification
- Plans: share of response tasks closed on time and number of overdue items by owner
Each metric should have an owner and a data source: monitoring and Service Desk, vulnerability reports, backup logs, task systems, or manual input with mandatory verification. Otherwise KPIs and KRIs quickly turn into "pretty numbers" people don't trust.
Step-by-step: how to design an ERM system from scratch
Start with agreements, not the registry screen. The system should answer a practical question: which risks stop us from reaching goals, who owns them and what to do when things worsen.
-
Define the foundation: objectives, risk categories (financial, IT, operational, compliance), probability and impact scales, appetite thresholds and escalation triggers.
-
Describe data and relationships. Usually five entities are enough: risk, control, response plan, incident, metric (KPI/KRI). Decide how they link: one risk can have several controls and plans; an incident may relate to one or multiple risks.
-
Fix processes so the register stays alive: creation and initial assessment, owner and controls approval, regular reviews by schedule and by events, escalation when thresholds are exceeded, closure or move to watch.
-
Define roles and access rights: risk owner, risk coordinator, controller, approver. Audit trail, comments on reassessments and decision history are useful.
Run a pilot on 1–2 processes where risks are already felt (e.g., critical IT service support or procurement). After 3–4 weeks gather facts: which fields are left empty, where approvals stall, which notifications are needed, and adjust the model to real work.
Common mistakes when implementing ERM
One frequent mistake is confusing a risk with an already occurred problem. The register fills with entries like "server crashed" or "delivery delayed" without recurrence conditions, causes and measures. Such a list becomes a complaints log.
Second, disagreements arise when assessments lack clear criteria. One manager gives probability "4" because "it seems frequent," another gives "2" because "it didn't happen last year" — the matrix becomes guesswork. You need clear scales, examples and appetite thresholds.
Third, plans without owners and deadlines. If a card lacks a responsible person and a due date, actions stay "in progress" for years.
Another bias is recording only inherent risk and not residual after controls. This scares leadership and triggers unnecessary projects even when the situation is managed.
Finally, metrics often live separately: KPIs and KRIs exist but don't change budget or task priorities.
Quick checklist for register and process quality
If the register is filled but unused, the issue is usually discipline: who updates, when and based on what events.
5 checks in 10 minutes
Review the register for the last quarter:
- Each card shows an owner (by role), next review date and current status
- For "red" risks there is a plan with dates and owners or a written decision to accept the risk
- Each material risk has at least one control and an indication of how well it works
- Incidents are linked to risks and actually change card data (level, probability, impact, plan status)
- There is a small set of metrics (usually 5–10) and a schedule for updates
Sign that the process works
Take a recent incident (e.g., 2-hour downtime of a critical service). If you cannot quickly answer which risk triggered, which controls failed, which KPI/KRI changed and what to do next, the register is not connected to reality.
A good initial goal: once a month a leader opens the top 10 risks and sees owners, actions, facts (incidents) and numbers (metrics) without extra meetings.
Example scenario: downtime of a critical service and how it's reflected in ERM
Imagine a critical service (e.g., patient appointment system or payment gateway) runs on a server. Due to a power supply or disk subsystem failure the service stops for two hours.
In the system this first appears as a risk, then as an incident that refines assessment and plans.
How it looks in the risk card
The card describes the possible event before it happens:
- Event: downtime of a critical system due to equipment failure
- Causes: component wear, overheating, maintenance errors, no spare parts
- Consequences: service downtime, lost revenue, SLA fines, reputational damage
- Inherent risk: probability and impact before controls
- Residual risk: assessment after current controls
Controls are linked to the risk as "what reduces probability/impact": monitoring (temperature, disks, power), redundancy (RAID, dual power, clustering), maintenance and replacement schedules, and scheduled recovery tests.
Incident and link to KPI/KRI
When the outage occurs, an incident record is created and tied to the risk: duration of downtime, direct damage, affected processes, root cause (e.g., PSU failure and lack of spare), corrective actions (procure spare parts, change redundancy scheme, strengthen temperature control) and responsible people with deadlines.
To keep the register alive, metrics are updated:
- KPI: service availability (%), mean time to restore (MTTR)
- KRI: number of critical monitoring alerts, share of successful recovery tests, percentage of overdue updates
If KRIs worsen, the risk is re-evaluated and response plans become more specific.
Next steps: pilot, reporting and implementation support
Run the first 4–6 weeks as a pilot: the goal is not to implement everything but to prove the system gives clear answers to leadership and helps teams act faster.
Keep the starter set simple: uniform templates for cards (risk, control, plan, incident, metric), assigned owners and a review calendar at least 3 months ahead. Decide where the pilot will live: a spreadsheet can work with discipline; a corporate platform is needed when access rights and audit trails matter.
Reporting decides everything next. Create one clear package (1–2 pages) and issue it regularly (e.g., monthly): top 10 risks by residual level and what changed, overdue plans with reasons, trends in key KRIs and threshold breaches, 3–5 incidents of the period and which risks they confirmed.
If ERM needs a platform, rights, integrations and analytics, it often depends on infrastructure and support. In such cases GSE.kz as a system integrator can help: they design and support the IT environment, and servers and workstations can be chosen from locally manufactured lines that meet reliability and procurement requirements.
FAQ
Where is the best place to start ERM implementation so it doesn't become a "table for the sake of a table"?
Start from the outcome leadership needs: top risks by residual level, overdue actions, breaches of appetite and new incidents. Then limit the pilot so risks are measurable, each has an owner and clear consequences.
How to choose pilot boundaries: how many processes and risks to include at the start?
For a first stage, 1–2 departments and 10–20 key processes are usually enough — choose areas where risks affect money, availability, safety or compliance. Start with operational and IT risks if you have critical services; add strategic and reputational topics later when update discipline exists.
What roles are needed in ERM and why shouldn't owner and executor be mixed?
Assign named roles: risk owner (decision-maker), executor (who maintains the card and updates statuses), approvers (who check assessments and plans) and observers (who use the data). Separate owner and executor so responsibility for decisions doesn't turn into mere record-keeping.
How often should risks be reviewed so the register stays up to date?
A typical rhythm: monthly quick checks of statuses and overdue actions; quarterly re-evaluation of probability and impact and review of controls; annually plan initiatives, budgets and targets for key risks. Also review after significant incidents so the register doesn't go stale.
Which fields must be present in a risk card?
Keep the risk card short and uniform: ID and title, simple description of the event, context (process, service, asset, department), owner, status and date of next review. This is enough to find, assign and regularly update a risk without extra bureaucracy.
How to set 1–5 scales so assessments don't become a debate of "seems frequent"?
Fix common scales for probability and impact, typically 1–5, and describe each point in terms of frequency and measurable consequences. Break impact into measurable categories (SLA downtime, financial loss, compliance fines, safety) so assessments are comparable.
Why count inherent and residual risk separately?
Inherent risk shows the level before controls, residual — after existing controls. Keep both to see which controls actually reduce risk and where escalation is needed, and where the situation is already managed.
How to describe controls so they can be checked and improved?
A control should be a concrete action or rule that reduces probability or impact and have an owner, frequency and clear evidence of execution. Store artifacts — logs, monitoring reports, test protocols — rather than a simple checkbox, so controls are verifiable and improvable.
How to link incidents to risks and keep the register "alive"?
Link each incident to the risk it realized, the controls that should have prevented or detected it, and the risk owner responsible for the fix. After investigation, update the risk assessment and action plan based on facts, otherwise the register will live apart from real losses and outages.
Which KPI and KRI should be added to ERM to make it practical?
Choose a small set of metrics that show dynamics, not just post‑mortem results: KRI as early warning signals and KPI for control and plan execution. Assign an owner and data source for each metric, otherwise the numbers become untrusted and won't drive decisions.