Energy Resource Accounting System: Metering Points, Readings and Reconciliation
Energy resource accounting system: how to define metering points, set reading frequency, detect anomalies and reconcile data with bills.
What energy resource accounting actually delivers in practice
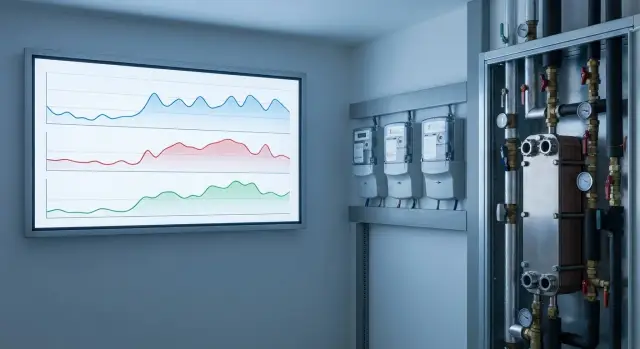
An energy resource accounting system is not just for charts. It helps you view consumption in a single format across electricity, heat and water. When data are collected consistently, you can compare buildings, workshops, tenants and periods without manual recalculation.
In practice, accounting answers simple questions: where and how much resource is actually used, why a bill suddenly increased, whether there are leaks or incorrect settings, and whether consumption matches operating mode. The main effect is transparency. Situations where operations say “it’s normal,” accounting sees rising costs, and everyone investigates blindly disappear.
A well‑configured system helps find losses and imbalances. For example, when input consumption is stable but the sum of internal points is noticeably lower. It also provides a basis for specific norms (kWh per m2, Gcal per patient, m3 of water per shift) and for control: are the norms met?
Success is measured not by “having a system,” but by data quality: readings must be accurate and in clear units, complete (no gaps), regular (according to schedule), comparable (same rules across sites) and verifiable (numbers can be confirmed from primary sources).
Roles are usually split this way. The energy engineer is responsible for the points structure, deviation analysis and root causes. Operations keep equipment in order and fix leaks or incorrect regimes. Accounting reconciles bills and closes the month based on unified data rather than email chains and guesses.
Directory of objects and metering points: how to set it up
Good accounting starts not with reports but with a clear directory: exactly where you measure, which resource and who is responsible. If the directory is made carefully, it’s easier to set up readings, find losses and reconcile bills.
Build the hierarchy so it matches reality: organization – site – building (or structure) – node – line/circuit. A node usually corresponds to a switchboard, heat point, incoming collector or pump station. A line/circuit is a branch where you can clearly identify a consumer or process.
It’s useful to separate points by purpose. At the input you record what comes from the supplier. At distribution you see where the resource goes within the site. At consumers you can manage usage (workshop, tenant, block). Highlight technological nodes separately where consumption is driven directly by equipment regime (boiler house, compressor, ventilation).
Don’t confuse resource and carrier. Electricity is usually in kWh, heat in Gcal, water in m3. But the carrier might differ: steam, hot water, or a heat‑transfer fluid in a circuit. This affects comparability and calculations.
To make the directory useful for finance and balances, assign each point at minimum: place in the hierarchy (site, node, line), point type (input, distribution, consumer, technological node), resource and units (plus carrier), owner/responsible unit (department, cost center, tenant), and balance and operational responsibility boundaries.
Example: an input meter may be on the supplier’s balance, while your operations will maintain it. If this is noted in advance, accounting shows not only numbers but a clear answer to “who should act” when a discrepancy appears.
Instrument passports and data channels
An instrument passport is a card without which a system quickly becomes a set of scattered readings. When the passport contains key fields, data are easier to trust, spikes are resolved faster and reconciliation with bills is calmer.
First, record identification and metrology: model and type, serial number, accuracy class, installation date and next calibration date. Keep the history of replacements and calibrations: what was taken, when, what replaced it and with which initial readings. Otherwise it’s easy to “lose” a month after a meter change if reports still show the old device.
Next come calculation parameters. For electricity — units, transformation coefficients (CT/PT), digit length and rounding rules. If metering is multi‑tariff, list tariff zones and calendar linkage (weekdays/weekends, seasonality). For heat and water it’s often important to record the type of flowmeter, presence of temperature/pressure sensors, and what is considered primary: volume, mass or energy.
Equally important is the instrument’s “geography”: site, room or node, exact installation location, brief wiring description, who is responsible for the node, where seals are and how to access the instrument. Simple example: a heat meter in the basement is accessible only via a key at security. If that isn’t specified, end‑of‑month readings are easily disrupted.
Describe the data channel as a separate block: manual entry, modem, AMR, BMS or SCADA. Record transmission frequency, source (primary device or concentrator), format (readings or profiles) and the person responsible for communications.
Finally, statuses: “operational,” “under calibration,” “replaced,” “temporarily unavailable.” Status should affect quality control: when “temporarily unavailable” the system shouldn’t flag gaps as errors, but it must require a reason and an expected restoration date.
Reading frequency and the accounting calendar
Reading frequency depends not on “what’s convenient” but on which decisions you want to make. Monthly readings are often enough for bill reconciliation. To save energy and find leaks you need more frequent data, otherwise problems appear too late.
Commonly three levels are used: hourly (or 15 minutes) for operational control and load, daily for stable accounting where AMR is absent, and monthly for period closure and reconciliation.
How to choose frequency by resource and task
A practical guideline: Electricity — hourly data is useful for peaks and demand penalties, daily is a reasonable minimum for control. Heat — during the heating season daily is preferable, while monthly totals are often enough for bills and specific norms. Water — daily data helps catch leaks; monthly totals are needed for contracts and limits. For balances it’s important that inputs and outputs are measured at the same frequency, otherwise an imbalance appears due to different intervals.
Reading windows and responsibilities
Fix the reading window: for example, each day by 10:00 for the previous day, and on the first working day of the month record the final reading at 00:00. For each point it should be clear who reads, who checks and who approves.
Predefine a plan for failures. If a reading is missing, do a repeat read and record the reason (no connection, meter replacement, maintenance). Use average‑based values only as a temporary measure and correct them later.
Example: at a school heat is read daily during season to notice excess consumption from open windows or automation failure. At month‑end record the final reading that matches the accounting close date. Then reconciliation becomes a check of numbers, not an investigation.
What data to collect and how to ensure quality
To produce reliable figures you need not only devices but data discipline. The same indicator recorded in different ways becomes an argument instead of a report.
Start with a unified recording format. For each reading record: date and time (with time zone and interval start/end flag), the raw value from the device, unit, source (meter, AMR, dispatching, manual), and identifiers for the metering point and instrument.
Agree on rounding rules. Good practice is to store the raw value separately and use rounded values only in reports. That makes small differences explainable and preserves the audit trail.
Data quality is easiest to maintain with automated checks. These should catch gaps, duplicates, time errors (future timestamps or wrong date), abrupt spikes, unit or sign changes (for example confusing m3 with thousands of m3).
If you measure heat, steam or gas, you often need reference tables for conversions: outdoor temperature, pressure, density, calorific value. Record the source and validity period for these parameters, otherwise the formula may be correct but the result random.
And keep a change log: who changed data, why and based on what document (act, photo of the display, supplier letter). Then disputes reduce to facts.
Anomaly control and deviation analysis
An anomaly is not just “looks different from last month.” It’s a signal that data or consumption require checking. The earlier you catch such cases, the fewer disputes at month‑end and the more accurate the balance.
Simple rules that catch most errors
Start with threshold checks. They don’t need complex analytics but they filter out typical problems: missed readings, swapped units, telemetry failures.
A good basic set: zero or “too little” on working days; “too much” for a day or week; negative consumption; meter reading less than the previous reading (physically impossible for most meters).
Then add checks for physical plausibility: cumulative readings should be monotonic, and period consumption should not exceed a realistic maximum for the point (by capacity, diameter, or contractual limits).
Comparisons that help identify causes
Compare with history accounting for seasonality and operating regime. Heat is better compared to the same period last year at similar temperature; electricity — to the same weekday, especially for schools and hospitals.
A powerful approach is to reconcile neighboring points. If there's an input to a building and the sum of distribution across blocks differs, the difference should be within understandable limits (losses, common needs, technical rooms). A sudden rise in the difference usually indicates a leak or bypass, an unmetered load, or an error in one of the points.
Record deviations as a short card: what changed, from which date, likely cause (maintenance, accident, downtime, meter replacement, new tenant or equipment), who confirms it and what action is required (repeat reading, calibration, coefficient adjustment, act). Then an anomaly becomes a task, not endless correspondence.
Reconciliation with bills and month‑end closing
For internal reports your readings and balances matter. But financial month‑end always rests on supplier bills, so reconciliation must be a separate, repeatable procedure with recorded results.
First check that the bill lists everything affecting the amount: billing period, supply point (account or contract), volume, tariffs (including time zones or tiers), charges, adjustments and applied coefficients (transformation and others if applicable).
A frequent cause of discrepancies is different periods. A bill may run 25th–24th while your readings use the calendar month. Decide in advance how to align: shift your reporting period to the supplier’s, or recalculate on month boundaries using daily or hourly data. If no detail is available, distributing by average daily consumption is acceptable, but the method must be fixed so “manual math” doesn’t change every month.
When investigating differences first exclude simple causes: different metering boundaries (building input versus internal meters), transformation coefficients, rounding, units (kWh vs kW, Gcal vs GJ, m3 vs adjusted m3). Then check for meter replacement, calibration, communication failures and estimated charges.
When values are agreed, fix the result: a reconciliation act or an internal memo with attached source readings, periods and conversion formulas. This greatly simplifies audits and prevents “it was different last month” questions.
A minimal month‑end routine is usually: the person responsible prepares a summary of readings and comments on deviations; accounting or an economist enters bill data and posts adjustments; the meter owner approves the result and, if the discrepancy exceeds a threshold, opens a supplier inquiry. Aim to complete the initial reconciliation within 1–2 business days after receiving the bill and escalate immediately if you see estimated charges or unusual coefficients.
Calculating losses, imbalance and resource balances
A resource balance answers a simple question: how much resource entered the site, how much reached consumers and where did part of it “disappear.” Build a separate balance for each resource (electricity, heat, water) and by levels: building input, distribution nodes, major consumers.
Basic logic: input (main meter or incoming node) = sum of useful consumption + losses + adjustments (for example tank level changes). Imbalance is the difference between input and the sum of all lower‑level points for the same period.
What to count as losses and imbalance
Divide losses by cause.
Technical — physics of the process (heat losses in networks, water leaks, transformer and cable losses). Commercial — metering errors and unaccounted consumption (stopped meter, wrong coefficient, period shift, missing readings). Methodological — mismatched balance boundaries (points located incorrectly, different periods, different units).
If imbalance is stable and small, it’s often the technical background. If it fluctuates, the cause is more often in the data: missing readings, wrong multipliers, stopped instruments, or duplicated points.
Normalization and temporary calculations
To compare periods, normalize input and losses: per area (kWh/m2, Gcal/m2), per bed, per product output or per number of visitors. This helps distinguish increased losses from increased load.
If you lack points, make a temporary balance: use the main input and 2–3 key consumers and treat the rest as “other.” At the same time make a plan to equip additional nodes: which nodes to measure first so the imbalance becomes manageable rather than just a number in a report.
Specific norms and performance indicators
Specific norms let you compare consumption not by total but by a clear base. Start with simple indicators: kWh/m2 for electricity, Gcal/m2 for heat, m3/person or m3/m2 for water. Decide in advance which indicator is primary for each site so rules don’t change on the fly.
For fair comparison you need comparable conditions: outside temperature (for heat often normalized by degree days), working hours and schedule, occupancy (visitors, patients, shifts) and the area actually used, not just the registered area.
Set norm boundaries: by building, by subdivision (for example kitchen, laundry) or by process (boiler house, pump station, ventilation). The closer to the process, the faster you see where consumption “leaks” and who influences it.
Also track KPI for accounting quality, otherwise norms will “dance” because of data. Minimums: timeliness of readings, share of valid data without gaps and manual edits, number of anomalies with identified causes, share of points reconciled with bills.
Practical meaning is simple. If specific heat (Gcal/m2) rises with similar weather and schedule, that supports a budget request for balancing heating, insulation or automation tuning. If water m3/person increases, start with checking leaks, bathrooms and cleaning routines before planning hardware replacement.
Example: setting up accounting in a school or hospital
Take a typical case: a single building of a school or hospital. On the input there’s a main electricity meter and a heat metering node, and for water there are two meters (building cold water and a separate meter for laundry or kitchen).
To avoid turning accounting into a table for the sake of a table, first carefully create the directory. In practice it’s enough that for each point boundaries, units and the responsible person are clear, as well as the point’s role (input, distribution, section), coefficients and settings (transformation, rounding, time zone), and the data source (manual reading or dispatching).
Then set a monthly reading calendar. For example, read water daily in the morning (to catch leaks), electricity once per day or week, heat daily during the heating season. Fix the rule: missed readings cannot be retroactively filled in without a comment.
Within a week the first anomalies usually appear. Nighttime water increases at 02:00–04:00 often point to a cistern leak or a non‑sealing valve in a technical room. A daytime heat drop may be a stopped circulation pump or a closed valve after maintenance. An electricity spike at night is often an electric boiler, ventilation on manual, or charging of special equipment.
At month‑end reconcile with the bill: check billing dates and closing hour, units and coefficients, meter replacements or calibrations and initial readings, estimated days in the bill, and that the accounting “input” point matches the supplier’s delivery point. A 6–8% heat discrepancy frequently turns out not to be losses but period difference (bill closed at midday) or a unit error (Gcal vs MWh).
Compute losses and imbalance by a simple balance: input minus sum of distribution points. For water this quickly reveals leaks; for electricity it highlights unmetered loads. Update the specific norm after corrections: kWh per m2, m3 per student or patient, Gcal per m2 per month. Within 1–2 months you see which measures actually reduced consumption and which only moved numbers on paper.
Short checklist before launch
Before starting, it’s more important to agree on accounting rules than to “turn the system on.” Otherwise data will quickly become disputable: it won’t be clear which points are primary, who reads and how to close the month.
Check three things.
-
Directory of objects and metering points: each point has a clear name, location (address or building/node), resource and units, and link to a site. Mark which points are commercial (for billing) and which are technological (for monitoring and finding losses).
-
Instrument passports and data channels: serial number and model, coefficients or transformers (if any), calibration dates, current status, data source (manual, AMR, dispatching, import).
-
Reading calendar and responsibilities: frequency for each resource and point, deadlines, responsible person and backup.
Before the first month set basic anomaly rules (spike, zero where consumption should be, reading rollback, consumption outside working hours, data absence beyond allowed time) and the reconciliation procedure with bills: which points participate, how to take “closing” readings, how supplier adjustments are handled and who approves the result. Useful rule: until reconciliation is fixed, numbers are preliminary and do not go into loss reports or specific norms.
Next steps: pilot, scaling and support
Start with an inventory. In 1–2 weeks collect a list of sites, instruments and metering points, check who reads and where data are stored (Excel, logbook, supplier portal). Mark problem spots immediately: no access to switchboard, instrument without calibration, unclear meter ownership.
For a pilot choose 1–2 sites where it’s easiest to put things in order and quickly see results, for example the main building and boiler house. In the pilot you will test directories, the reading calendar, anomaly control and reconciliation without affecting the whole footprint.
To keep the pilot from “failing” in the first month define the minimum IT components upfront: where to store directories and readings, what the application will run on (server or VM), what workstations responsible persons need, how backups work, and which data input channels are used (manual entry, import, automatic collection).
During scaling operations matter more than reports. Fix roles and permissions (who inputs, who approves, who sees financial data), enable action logging and set up availability checks: what to do if a data channel fails or readings don’t arrive.
If reliable local and central infrastructure is required, GSE.kz (gse.kz) can help with supplying domestic PCs and servers, system integration and 24/7 technical support via a nationwide service network.
FAQ
Why do we need an energy resource accounting system if we already have supplier bills?
Practical effect — transparency of consumption and quick answers to simple questions: where consumption is rising, when it started, and whether it’s a real overuse or a data error. When electricity, heat and water are collected according to common rules, they can be compared across buildings, workshops and tenants without manual recalculation. This simplifies investigating deviations and reduces disputes during month-end closing.
How should I structure the directory of objects and metering points so I don't have to redo it later?
Build the hierarchy as it exists on site: organization, site, building, node, line or circuit. That way any metering point is immediately clear by address, by schematic and by who is responsible for it. Fewer “virtual” names and more ties to actual switchboards, heat points and collectors make the accounting much easier to maintain.
What fields must every metering point have?
At minimum — position in the hierarchy, point type (input, distribution, consumer, technological node), resource and units, plus the responsible party and balance boundaries. Add the carrier if relevant for calculations (for example, steam or heat-transfer fluid). Also define in advance who should act on discrepancies: operation, energy engineer, tenant or supplier.
Why is an instrument passport needed and what is most important in it?
The instrument passport makes readings verifiable: model, serial number, accuracy class, installation and calibration dates, and the replacement history with initial readings. Without this, a sudden consumption spike is easy to misinterpret as a meter change or coefficient error. With a filled passport, deviation analysis and bill reconciliation usually proceed without lengthy investigations.
How often should readings be taken for electricity, heat and water?
Choose frequency based on the decisions you want to make. For month‑end reconciliation, monthly readings are often sufficient; to find leaks and misoperation you need daily or hourly data. Electricity benefits from finer granularity because of peaks and demand charges, water for detecting leaks, and heat for the heating season. It’s important that inflows and outflows are recorded with the same frequency, otherwise an imbalance will be created by differing intervals.
What to do if a reading didn't arrive on time or a reading was missed?
Set a reading window — for example, daily by 10:00 for the previous day, and on the first working day of the month record the final reading at 00:00. Each point must have a clear owner: who reads, who checks and who approves. Prepare a contingency plan: if a reading did not arrive, attempt a repeat read, record the reason (no connection, meter replaced, maintenance). Use average‑based values only temporarily and correct them later. The goal is clear period boundaries and consistent discipline across all points.
What data should be recorded at each reading so it can be trusted?
Store date and time with time zone and whether the value is interval start or end; point and instrument identifiers; the raw value as received from the device; units; data source (meter, AMR, BMS/SCADA, manual entry) and the interval tag. Agree rounding rules: keep the raw value separately and use rounded values only in reports. That way small differences can be explained rather than lost in manual edits.
Which rules most easily catch anomalies and accounting errors?
Start with threshold checks that catch most problems: missing reading, zero where there should be consumption, too large a daily or weekly value, negative consumption, or a reading lower than the previous one. Then add sanity checks: monotonic increase of cumulative meters, realistic maximums for the point (based on capacity or diameter), and comparisons with neighboring points in the balance. Treat an anomaly as a short task with the start date, likely cause and required action, otherwise it becomes endless correspondence.
Why do accounting data and bills differ, and how to reconcile them correctly?
First check periods, supply point, volumes, tariffs and coefficients, including transformation ratios and time zones if applicable. A common reason for differences is mismatched periods — for example the supplier’s bill runs 25th–24th while your readings are calendar-month. Agree in advance how to align periods. Document the reconciliation result (reconciliation act or memo) with source readings, periods and conversion formulas to avoid repeating the same investigation next month.
How to calculate losses and imbalance, and how to move to specific consumption norms?
Basic balance logic is simple: the input reading (main meter or incoming node) equals the sum of useful consumption plus losses and adjustments (for example tank level changes). Imbalance is the difference between the input and the sum of lower‑level points for the same period. If imbalance is stable and small, it’s often the technical background; if it jumps, the issue is usually data, boundaries or coefficients. Start specific consumption metrics on a clear base (per square meter or per person) and update them only after data corrections so you compare real consumption, not data quality.