Dell PowerEdge R660 for Kubernetes: CPU, RAM, NVMe and Network
Dell PowerEdge R660 for Kubernetes: how to choose cores, RAM and local NVMe for pod density and which network settings most often become bottlenecks.
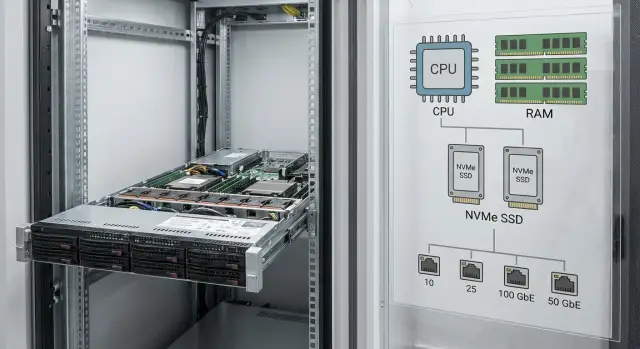
What a 1U node is for in Kubernetes
A 1U server in Kubernetes is often chosen as a dense, predictable "building block" of the cluster: a lot of compute in a small rack unit, easy rack-scale expansion and straightforward replacement on failure. Dell PowerEdge R660 is typically considered in this way: a single node should reliably run dozens of microservices and not "fall apart" during peaks.
In practice a 1U node rarely hits just one limit. Pod density is constrained by several factors at once: how many cores are actually available to applications, how much memory limits and caches consume, how much system components (kubelet, container runtime, CNI/CSI, logging) take, and how quickly disks and network digest many small operations.
"Pod density" is not just the number of containers running. It's the balance of requests/limits, actual consumption and overhead. Even "light" pods can hit memory limits because of page cache and sidecars, or CPU because of TLS, service mesh, metrics and logging.
Bottlenecks usually reveal themselves by behavior:
- CPU: increased latency, HPA constantly scaling with little effect; request processing times grow.
- Memory: OOMKilled, frequent restarts, node enters MemoryPressure and actual density drops.
- Disk: slow pod startup, slower log writes, basic operations stall under IOPS peaks.
- Network: fluctuating RTT between services, more retries, reduced throughput—especially on east-west traffic.
Before selecting a configuration it's important to collect a minimal set of inputs, otherwise the calculation becomes guesswork. Usually it's enough to know:
- the target number of pods per node and how many are system pods;
- typical and "heavy" pod requests/limits for CPU and RAM;
- load profile (steady, spiky, CPU bursts);
- disk requirements (capacity, IOPS, write share, need for local cache);
- network profile (ingress, east-west traffic, TLS/service mesh, packet characteristics).
Simple example: the team says "60 pods per node", but half of them have sidecars plus active metrics and logging. In the end real density is limited not by the 1U form-factor, but by how much resource you reserved for system overhead and peaks, and where the node starts to "breathe hard."
How Kubernetes actually uses CPU and memory on a node
Kubernetes scheduler places pods on nodes by requests, not by limits. Requests are a guarantee: that amount of CPU and memory is reserved for the pod. Limits are a ceiling: the pod cannot exceed them. If requests are low while limits are high, the cluster can be filled with pods on paper, and during peaks resource contention will occur.
CPU is more forgiving: when a container exceeds its request, it can use more CPU if the node has free cycles. When no free CPU remains, CPU time is shared and if a limit is set throttling occurs (the container is slowed). Keep in mind that 1 vCPU in a manifest is not the same as a physical core—on servers with Hyper-Threading and mixed loads the real performance of "1 vCPU" varies.
Memory is stricter. If a container exceeds its memory limit it is simply killed (OOMKill). Therefore pod density often hits RAM before CPU. Applications also have hidden consumption: caches, JVM/Go overhead, buffers, page cache, plus sidecars (service mesh, proxies) and agents.
Account separately for constant system overhead. Even without your pods, resources are taken by kubelet, the container runtime, CNI and DaemonSets (logging, monitoring, security), along with OS services and file cache.
Example: you estimate 40 pods at 250m CPU and 512 MiB each. By requests that's 10 vCPU and 20 GiB. But if the node uses 4–6 GiB for system and DaemonSets, and some pods actually consume 700–800 MiB, RAM becomes the limiter. The node will start seeing OOMs long before CPU shows red.
What to ask the application team before sizing
Before sizing cores, RAM and NVMe, clarify several things with the application team. Otherwise it's easy to pick an "average" node that looks good on paper but hits limits on the first peak.
First, fix the load profile. Some services are CPU-bound (compute, encryption, compression), others memory-bound (caches, large objects, JVM), others disk-bound (logging, temp files, queues), and others network‑bound (frequent calls, gRPC/REST, streaming). The same pod may be CPU-bound during the day and network-heavy during a nightly batch.
Pod density matters but it's not the only metric. Ask how many pods are actually needed per node and why. Sometimes the goal of "100 pods per node" breaks down due to DaemonSets, IP limits, isolation requirements or because 10 "heavy" pods are more valuable than 80 "light" but unstable ones.
Fix SLOs—otherwise it's unclear what success means: latency, throughput, response time. Also define recovery: how many minutes of downtime is acceptable for node failure and how quickly should the service return.
A list of questions that usually provides most of the needed data:
- current CPU and memory requests/limits and whether there have been OOMKills or throttling;
- peaks in RPS and response size, what happens at 2–3× load;
- deployment behavior: how many replicas are restarted simultaneously, is there a cache warm‑up period;
- any local state (temp files, caches, queues) and required IOPS;
- which dependencies are the heaviest on the network and what latencies are acceptable.
Example: a team calls a service "light", but during rolling updates they start two replicas in parallel, warm caches for 3–5 minutes and consume twice the RAM while actively writing to disk. This changes the sizing: you need memory and I/O headroom, otherwise density will suffer during releases.
CPU sizing for pod density: step by step
Start CPU calculation not from "how many cores fit in 1U", but from how much CPU the scheduler will request and how much CPU the services actually need under load.
1) Collect node profile by requests/limits
Sum CPU requests and limits (or at least requests) for each service and multiply by the planned number of replicas per node. Highlight pods with bursts (background jobs, queues, reports). Requests primarily limit density: the scheduler will not place more pods on a node than the sum of requests allows.
2) Add system reserve
There are always steady CPU consumers on a node: kubelet, the container runtime, CNI, DNS, logging, monitoring, security agents. If you leave them no headroom you will see rare but painful latency spikes. A practical approach is to reserve some cores for system and agent processes and not include them in available capacity for applications.
3) Choose a target utilization
Keeping CPU constantly at the limit is bad for microservices: latency increases, request queues grow and GC pauses in JVM/Go lengthen. Plan so that typical utilization is below maximum, leaving headroom for bursts and pod rescheduling.
4) Compare "what fits" and "how it behaves"
Density is constrained by the sum of requests, real performance (clock frequency, workload type, peaks), limit policies (throttling), network load (CPU for packet processing) and pod structure (many small vs fewer heavy pods).
If requests say many pods fit but services are latency-sensitive, comfortable density will be lower.
5) Check frequency, NUMA and context switches
In 1U chassis you can pack many cores, but that doesn't always help. For latency-sensitive services, high per-core frequency matters more than total core count. Too many small pods with active threads increase context switching and waste CPU. For heavy multi-threaded pods, test for NUMA effects and performance loss when threads migrate across sockets.
RAM sizing: avoid OOMs and preserve density
OOM in Kubernetes often looks like "not enough RAM", but the cause can be different. The most common case: a pod has too low a memory limit; the app spikes (cache, traffic, warm‑up) and the kernel kills the process even though the node still has free memory. The opposite mistake also happens: limits are set high and the scheduler stops packing pods even though real usage is lower.
A practical node calculation should be based on requests, not nominal RAM. Sum memory requests for all pods you plan to host on the node and add headroom for what requests typically don't account for: page cache, buffers, system processes, kubelet, container runtime, CNI, logging.
Guidelines:
- sum memory requests for target density and add 20–40% for peaks and uneven load;
- reserve RAM for the OS and node components (this can be a significant share, especially with many agents);
- leave space for page cache if containers actively read images, configs, logs or work with local disk;
- check if important pods run as BestEffort or Burstable without real limits: they are the first to suffer from memory pressure.
When is more RAM per node preferable vs more smaller nodes? More RAM helps pack microservices and reduce hardware count, but a larger node increases the blast radius on failure and complicates rolling updates. If you have strict SLOs and critical services, often 2–3 smaller nodes are better than one very large node so a single failure or drain doesn't remove half your pods.
Runtimes affect the calculation. Java often hits heap limits: set Xmx significantly below the limit, otherwise metadata, JIT and direct buffers can push you out of memory. .NET may fragment memory under load, so being "consistently under limit" doesn't guarantee no spikes. Python uses arenas and RSS can grow even after GC.
If OOMs repeat, don't rush to add RAM. First check whether RSS grows steadily (possible leak), whether GC patterns show spikes, and if kills align with traffic peaks. Example: a service with request 512 MiB and limit 600 MiB may fail once a day during cache warm‑up even though average usage is 350 MiB. In that case raise the limit and tune the cache rather than increasing node RAM blindly.
Local NVMe: where they help and where they introduce risk
Local NVMe in a 1U server often gives the most noticeable improvement in the perceived speed of a Kubernetes node. But understand what you accelerate: images, writable layers, emptyDir, application caches, logs and any temporary files live on local disk.
NVMe is justified when pods do many small reads/writes and latency matters more than capacity. Typical examples: local caches, fast scratch for file processing, queues and intermediate results. Another benefit is faster deployments thanks to quicker image pulls and unpacking.
The risk is where data must survive node failure and be easily moved to another node. If critical state is on local NVMe, a reboot or node replacement causes data loss or long downtime. For such workloads prefer networked storage so Stateful pods can be recreated and moved safely.
When choosing NVMe look beyond terabytes. For pod density you often hit IOPS and latency limits, especially on writes. Estimate the profile: how many pods write concurrently, the size of writes, and the behavior during peaks (logging, backups, compaction, mass restarts).
Practices that prevent surprises:
- separate the system disk from the disk used by the container runtime and images;
- place caches and emptyDir on a dedicated volume/partition so temporary data doesn't consume image space;
- set requests/limits for ephemeral storage so a noisy pod cannot fill the entire disk;
- monitor inodes and cleanup speed: "space exists but you can't write" happens more often than expected.
If NVMe is used as an accelerator rather than the sole storage, the node is fast and predictable. Mixing everything on one volume and keeping critical data locally usually reveals problems at the worst moment.
Network options that commonly create bottlenecks
Even with CPU, RAM and NVMe sized correctly, the cluster can feel slow because of the network. A network bottleneck often appears as "simply slow requests" rather than an obvious failure.
MTU, jumbo frames and hidden fragmentation
The most common small mistake is mismatched MTU along the path. For example, jumbo frames enabled on nodes while some switch or the path to a load balancer uses the standard MTU. The result is fragmentation or drops, retransmits and latency spikes. In Kubernetes this is especially visible with CNIs that encapsulate traffic (VXLAN/Geneve): tunnels add overhead, and the effective MTU becomes smaller.
Practical rule: pick a single MTU for the whole path and verify it end‑to‑end, including uplink, ToR, inter-switch links and any external firewalls/load balancers. Jumbo frames help where many large packets are present (replication, backups, large responses) but break interaction if any segment is unprepared.
NIC queues, RSS and the "one hot thread"
Often the issue is not port throughput but that packet processing is bottlenecked on one core. If RSS (distribution of flows across queues) is misconfigured or there are too few queues, a single busy pod or service can saturate one queue. Latency grows even if link utilization seems modest.
Bonding/LACP and poor hashing
Link aggregation doesn't always give linear gain. With LACP, traffic from one flow can stick to one physical port due to the hash (MAC/IP/port). Typical case: one extremely active service or ingress, and half the bond sits idle.
CNI, encapsulation and service mesh
CNI tunnels add overhead and CPU load, and service mesh increases east‑west traffic adding hops, encryption and a proxy on each request. In microservices latencies rise more than CPU graphs suggest.
What helps most when done in order:
- align MTU end‑to‑end and account for CNI tunnel overhead;
- enable and test RSS, queue counts and interrupt affinity;
- check LACP hashing policy against your traffic shape (many short or few long sessions);
- measure p95/p99 east‑west latency with and without mesh on a testbed;
- avoid enabling multiple "accelerating" options at once without before/after measurements.
Example: after enabling a service mesh you see higher pod‑to‑pod latency while port utilization looks normal. The cause is often CPU used for packet processing, NIC queues and extra proxy logic—not the raw link itself.
Common mistakes in node sizing and configuration
Even a well-chosen 1U server can yield low pod density because of typical oversights. Below are the things that most often break performance and total cost of ownership when PowerEdge R660 is used as a general-purpose microservices node.
CPU: numbers on paper, no benefit in practice
A common mistake is inflated CPU limits: the scheduler sees the node as "occupied" while real load is low and you lose density. The opposite mistake is many tiny pods with tiny requests: overhead increases, context switches grow and CPU is wasted on scheduling instead of business logic.
Another risk is pinning and dedicated cores without understanding NUMA. On a dual-socket 1U you can see increased latency if pods access memory across a remote socket.
RAM: OOM does not always mean "not enough memory"
Requests are often set below actual average consumption, ignoring peaks. The result is OOMKills and restarts. Another mistake is no headroom for system processes, kubelet, CNI and page cache. Ignoring caches also forces more disk reads and services suffer in latency and density.
Local NVMe: fast but easy to exhaust
Local disks get filled with images, temp files and logs. If everything writes to one NVMe that also hosts containerd, queues form and when the disk fills pods start failing. Typical scenario: verbose logging enabled for a day and free space disappears overnight.
Network and ops: a hard-to-see bottleneck
Network issues often look like "slow services." Frequent causes: mismatched MTU between node, CNI and network; incorrect LACP; limits at virtual switch or policy level (rate limits, security rules); unsuitable interrupt and queue configuration on NICs; lack of observability and load testing.
If metrics, logs and traces are not collected in advance you'll end up arguing "is it CPU or network" rather than finding the concrete limit and fixing it.
Quick checklist: what to check before purchase and after rollout
If you choose Dell PowerEdge R660 for Kubernetes, keep a simple goal: the node should sustain the required pod density without CPU throttling, memory OOMs, disk queues or network drops.
Before purchase: capture the load profile
Collect data not by average but by peaks (p95) and by symptoms.
- CPU: average and p95 utilization per node, presence of throttling, run queue length, rise in context switches.
- RAM: working set, role of page cache, frequency of OOMs and signs of memory pressure.
- Disk: occupancy, p95 IOPS/latency, queues, write behavior under load.
- Network: drops, retransmits, p95 latency and interface utilization by direction (pod-pod, pod-service, ingress-egress).
- Kubernetes: eviction frequency, container restarts, pod start time, image pull speed.
After rollout: ensure the node holds density
For the first 1–2 weeks watch metrics and events.
- Pod stability: no spikes in restarts and evictions under typical peaks.
- CPU without surprises: if p95 approaches 100% and throttling rises, density is already hitting a limit.
- Memory without hidden leaks: if working set grows and page cache is constantly evicted, both speed and density suffer.
- Disk without queues: rising write latency for logs or temp files quickly affects tail latency of microservices.
- Network without losses: recurring retransmits and growing p95 latency usually point to misconfiguration (port speed, bond/LACP, offload, MTU) or insufficient bandwidth.
A practical technique: choose 2–3 of the noisiest services and run their typical peak. If they cause throttling, OOMs, disk queue growth or retransmits, the node hits a limit sooner than dry numbers suggest.
Example sizing for a typical microservices cluster
Imagine a Dell PowerEdge R660 node in a cluster of 20–40 microservices: some handle HTTP, some work with queues, plus a small cache and background workers. The goal is to host many pods without latency spikes or unexpected restarts.
Rough CPU and RAM calculation
Start from the average pod profile. Suppose observed requests are:
- CPU request: 250m per pod
- RAM request: 600 MiB per pod
- Average CPU peak: up to 800m
- Average RAM peak: up to 1.2 GiB
- Replicas on average: 2–3 per service
Now node capacity. If the node has 32 physical cores and 256 GB RAM, don't give it all to Kubernetes: reserve 1–2 cores and 8–16 GB for the OS, kubelet, logs and DaemonSets (monitoring, CNI, CSI). That leaves about 30 cores and 230 GB.
By CPU: 30 / 0.25 ≈ 120 pods by requests. By memory: 230 / 0.6 ≈ 380 pods. So CPU limits here. Realistic density will be closer to 80–110 pods if you want headroom for peaks and to avoid constant throttling.
Local NVMe can significantly speed up deploys and restarts (faster pulls and image unpacking, faster ephemeral storage, local caches). But caches and queues on local NVMe must be either easily reconstructable or replicated at the application level; otherwise node loss means data loss.
Typical network issue and how to spot it
In such a cluster the network constraint is often not the raw port speed but configuration and CPU load: overloaded conntrack, extra NAT, bad MTU, too few NIC queues, or network interrupts consuming cores.
Signs in metrics that the node became network-bound:
- p95/p99 HTTP latency rises while CPU by requests looks normal;
- interface drops/errors and retransmits increase;
- conntrack utilization and timeouts grow;
- system/softirq CPU rises together with traffic.
A common compromise is to reduce node pod density by 10–20% and reserve resources (CPU/RAM) for system components and networking. Peak throughput may drop, but latency becomes more stable and the cluster is easier to operate.
Next steps: pilot, verification and scaling
Before ordering a batch of servers agree on simple goals: which SLOs matter (latency, errors, recovery time), what pod density is required per node, and what utilization counts as normal for CPU, RAM, disk and network. This turns the question "how many cores" into a clear calculation and reduces the risk of overspending or hitting limits.
A pilot is best on 1–2 identical nodes close to the target configuration. Run not synthetic benchmarks but your real profile: your Ingress, CNI, images, limits and typical peaks.
Mini-pilot: what to check in 1–2 weeks
Record numbers in one place and compare "planned" vs "actual."
- Align requests/limits with real usage and mark where density is cut by memory vs CPU.
- Test network: east‑west throughput, p95 latency, errors/drops and MTU alignment.
- Test local NVMe: p95 write latency, behavior when nearing full, reaction to pod restarts and log bursts.
- Observe autoscalers and evictions: how many pods are actually recreated under peak.
After the pilot codify standards so results repeat: templates for requests/limits, logging rules, image policies (size, pull frequency), unified MTU and driver parameters.
Growth plan: predictable scaling
Think beyond "add nodes" to "what node roles we need." Separate roles when useful: compute for microservices, dedicated ingress nodes, and nodes for stateful workloads. Plan for at least N+1 capacity to handle maintenance, upgrades and spikes. Define expansion procedures: how many nodes to add at once and how to validate network and storage are not the next bottleneck.
If you need help with sizing, piloting and datacenter commissioning, GSE.kz can act as a system integrator: select and deliver servers and infrastructure, then provide 24/7 support via a service network across Kazakhstan.
FAQ
Why choose a 1U server for Kubernetes instead of a larger machine?
1U nodes are usually chosen as a predictable "scaling unit": add a server to the rack and you get a clear capacity increase and an easy replacement in case of failure. They are especially convenient for microservices where you need to scale the cluster quickly and keep a consistent node profile.
What actually limits pod density on a single node?
The scheduler places pods according to **requests**, not **limits**, so density is most often constrained by the total of requests plus the reserve for system components. If requests are underestimated, many pods will fit on paper, but during peaks you'll get resource contention, higher latencies and instability.
How to estimate how much CPU is needed on a node for a given number of pods?
Start from the sum of CPU **requests** for the pods you plan to host on the node, and subtract a reserve for kubelet, the container runtime, CNI and DaemonSet agents. Then size the node so typical load does not hit 100%, because latency rises well before obvious failures appear.
How can I tell we've hit CPU limits and throttling has started?
**Throttling** shows as "the node is alive but the service is slow": latencies increase, request queues grow, HPA may constantly scale with little effect. It's often caused by tight CPU limits or many pods trying to use more CPU than available.
Why are pods OOMKilled even when it looks like there is enough RAM on the server?
OOM in Kubernetes often happens because the **memory limit** is set too low for the workload, not because the server as a whole lacks RAM. A practical approach is to keep limits with headroom for warm‑up, traffic spikes and runtime specifics (for example, JVM), and also reserve space for system overhead and page cache, otherwise density will drop under real load.
How to calculate RAM per node correctly to avoid losing pod density?
Base your calculation on the sum of **memory requests** for the target density and add margin for peaks and the "hidden" memory that manifests but is often not declared in manifests. If you want fewer restarts and evictions, reserve capacity for the OS, DaemonSet agents and file cache rather than blindly increasing node size later.
When do local NVMe drives actually improve Kubernetes performance?
Local NVMe is especially useful for fast image pulls and unpacking, temporary files and caches where low latency on small operations matters. The risk is when critical state resides on local NVMe: if a node fails or is serviced, you may lose data or face long downtime. For persistent state use remote/external storage or application-level replication.
Which network settings most often become bottlenecks in a cluster?
The most common network issue is mismatched MTU along the path, which causes fragmentation, drops and retries—especially visible with CNIs that encapsulate traffic. Another frequent scenario is network processing bottlenecking on a single core due to NIC queues and softirq handling: the port looks fine but p95/p99 latencies grow.
How to tell if the disk is the bottleneck rather than CPU or memory?
If pods take a long time to start, log writes slow down and basic operations 'hang', check p95 disk latency and ephemeral storage usage. A frequent cause is a noisy pod filling the disk with logs or temp files, so set ephemeral storage requests/limits and monitor cleanup.
What should I check in a pilot before buying a batch of servers for Kubernetes?
A pilot on 1–2 nodes must reproduce the real picture: your CNI, Ingress, images, limits and typical peaks—otherwise conclusions will be wrong. If you need help with sizing, delivery and commissioning, GSE.kz can act as a system integrator and provide 24/7 support across Kazakhstan.