DCIM for Server Rooms and Mini-DCs: Choosing by Integrations
DCIM for server rooms: how to compare Sunbird, EcoStruxure IT and Nlyte on sensor integrations, power reports and incident procedures.
Why DCIM for a server room and mini-DC, in plain terms
DCIM is a system that helps keep a server room or mini-DC in order: what is located where, how much power is consumed, where it overheats, and who should respond. Essentially, DCIM gives a "single pane of glass" so you guess less and run to racks less often.
In small sites many things are handled manually: equipment lists in Excel, serial numbers in notes, power estimates "by eye", incidents handled via calls and messages. Problems start when people change, load grows, or a second cabinet appears. Diagrams get outdated, sensors get mixed up, port labels diverge from reality, and nobody remembers "who last touched the PDU."
The practical benefits of DCIM usually boil down to four things: accurate inventory (racks, ports, connections, sensors), monitoring (temperature, humidity, power, UPS and PDU), disciplined response (who does what and the history of actions), and planning (where there is spare power and space and where you are close to limits).
Example: in a mini-DC with 2–3 racks the load grows in the evening and one PDU approaches its limit. Without DCIM this is often noticed late — when a service fails or a local indicator lights up. With DCIM you see consumption trends, get a pre-warning, and can redistribute load or schedule power upgrades before an outage.
It’s important to understand the boundaries. DCIM does not replace ITSM (tickets, approvals, SLAs) and it's not a full BMS (building automation). But DCIM covers the seam between IT and engineering well: monitoring, inventory, reports and clear incident response procedures.
Characteristics of mini-DCs: what affects platform choice
Mini-DCs operate under different rules than large data centers. Often there is no separate engineering team; 1–2 people run operations alongside other tasks. So DCIM must deliver value quickly: without long configuration and maintenance-heavy procedures that no one has time to support.
In a mini-DC, «pretty maps» are often less important than manageability: being able to see sensors, power, failures and produce simple reports for management and auditors. If a system takes weeks just to start collecting temperature and PDU load, that’s a warning sign.
1–2 racks vs dozens of racks — different scenarios
For 1–2 racks, clear alerts, a couple of reports and an event history are often enough. At a site with dozens of racks, processes become more demanding: capacity tracking, naming standards, roles and responsibilities, integrations with ticketing and change calendars.
For mini-DCs, selection is usually driven by practical items: support for your sensors and protocols, rack-level power monitoring (PDU, UPS, inputs, phases, limits, overload history), fast alerts (on-call, escalation, “silence” during maintenance), simple reports (overheats, power reserve, missing data) and administration (roles, audit logs, backups).
Audit and regulators: what to remember
Even small server rooms often have internal audit requirements: who changed thresholds, who acknowledged an incident, why equipment operated at the limit. Ask in advance how long history is stored, whether immutable event logs exist, how access rights are separated (view vs edit), and if reports can be exported in formats convenient for audits.
A simple example: a leak sensor triggered at night. A good platform not only sends the alert but also saves the chain of actions: who accepted the alarm, who cut load on the PDU, and how long recovery took.
Integrations with sensors and engineering equipment
DCIM is only as valuable as its view of the real engineering picture. Before choosing, make a list of data sources you already have and those that will appear within a year. The usual minimum: UPS (load, run time, events), PDU (currents by phase, sometimes per-outlet load and remote control), energy meters at inputs and lines, air conditioning and ventilation, racks/cabinets (locks, sensors, sometimes controllers).
More important than vendor logos are connection methods. For hardware you commonly see SNMP and Modbus (TCP/RTU via gateway), in building engineering — BACnet, for servers — IPMI or Redfish, and for system exchange — APIs. Check in advance what is supported out of the box and where drivers, gateways or custom work will be required.
Vendor-neutral in practice means two things: the system does not force you to buy sensors and PDUs from one brand, and it can operate in a mixed environment (for example, one UPS via SNMP, another via Modbus, part of telemetry via BMS, server metrics via Redfish).
How to tell if an integration is good
The best way is a pilot. Evaluate poll frequency (usually 30–60 seconds for power and temperatures), accuracy (agreement with meter/UPS readings), stability (no gaps in charts). Also check how the system handles network outages: are data gaps marked, is there buffering, how are events logged.
Plan sensors based on risk, not "what everyone does." For a mini-DC a basic set is usually enough: temperature and humidity at cold-air intake and in hot zones, leak sensors under the AC and near pipe entries/risers, smoke (integration with fire alarm or a separate detector), door events (rack and/or room), vibration if a lift, generator or construction is nearby.
A good test is to simulate a scenario: rack temperature rises while PDU load increases. The system should quickly show exactly where the problem is, correlate signals and save a clear history for root-cause analysis.
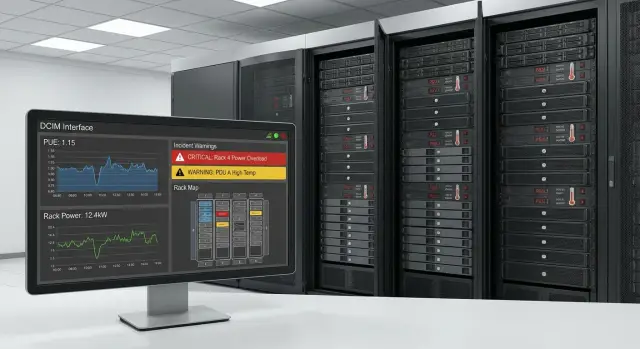
Power and capacity reports: what the system should provide
Reports in DCIM aren’t for "pretty charts" alone but to quickly answer simple questions: where is power reserve running out, what is overloaded at peak, and can we add a new server safely. In mini-DCs, eyeballing capacity runs out suddenly.
A practical set of reports is usually organized by three views: rack, power line (PDU/UPS/input) and room. Reports must be equally understandable to engineers and managers, and figures should be verifiable against raw data.
Commonly used reports include: per-rack (current load, peak for period, reserve to thresholds, phase imbalance), per-PDU/line (load distribution, overloaded groups, overload history), per-UPS (in/out, runtime at current load, battery health — if supported), per-room (aggregate consumption, trends, link to temperature), and capacity (how many watts remain in a rack and on the input).
Look at current values, peaks and trends. Average load often looks safe while overloads happen on Monday mornings or during backups.
Set thresholds and alerts first, otherwise you'll get silence or hundreds of useless notifications. A common starting point is warning at 70–80% of circuit or PDU limit and critical at 90–95% (per your policy), plus monitoring phase imbalance and rack overheating. If you have scheduled peaks (nightly tasks), handle them with separate rules.
For capacity planning a simple "add a server" model is useful. The system should show where it fits in the rack, PDU, UPS and input and how much reserve remains. Example: a new node consumes 600 W — rack has space, but a PDU branch is near its limit, so move load.
Export is another consideration. Management usually wants short PDF or spreadsheet reports; operations need raw data (CSV) and scheduled reports.
Incident procedures and operations: how it should work
DCIM is useful not just for charts. It should help the on-call person quickly know: what happened, where, and what to do next. For that you need a uniform incident cycle and clear roles.
Incident cycle without chaos
A normal flow looks like: the system logs an event, the responsible person confirms it (is it false?), actions are taken per instruction, and the incident is closed with cause and recorded steps.
Alerts should arrive through channels people actually use: email for details, SMS for critical alarms, messenger for fast coordination. If you have a Service Desk, auto-create a ticket linked to the rack/device, current readings and priority.
Escalations should be formalized: if a critical incident is not acknowledged in 5–10 minutes, escalate to the next level (senior engineer, shift lead, contractor).
Logs and audit are mandatory: it must be visible who changed thresholds, who silenced alerts, who closed incidents. This helps analyze causes instead of hunting for blame.
Typical scenarios
Create playbooks for overheating, phase/line overload, sensor failure (no data, spikes), loss of monitoring connection and recurring false alerts.
Example: if temperature rises, the system increases priority, creates a ticket, sends SMS to the on-call and attaches the sensor history. The on-call sees the issue is localized to one rack and follows the template.
Sunbird, EcoStruxure IT and Nlyte: how to compare without marketing
Compare platforms by choosing key criteria upfront: time-to-deploy, depth of integrations with sensors and engineering, ease of power and capacity reporting, and support for processes and roles.
EcoStruxure IT is often considered when you need quick monitoring and alerts integrated with Schneider Electric’s ecosystem. Sunbird is frequently chosen for clear dashboards and practical rack reports (when quick answers on overheating and power are important). Nlyte is usually evaluated when processes, roles, change control and operational discipline matter in larger environments.
To make the comparison fair, ask each vendor the same questions: licensing model, behavior with growing assets, which integrations are supported out of the box, where gateways/drivers are needed, how roles and permissions work, whether there’s an API and ready-made reports for power, capacity and incidents.
In demos, ask to show not just a pretty screen but the chain: sensor event → incident → assignment → action log → time-to-resolution report.
Also check vendor lock-in risk: support for a mixed fleet (PDU, UPS, sensors, BMS) and good data export are often more important than marketing claims.
Step-by-step selection and pilot: from requirements to acceptance
To pick a DCIM without surprises, start from what data you can realistically collect and how you will use it. A pilot on 1–2 racks almost always saves time and quickly shows data quality.
Minimal 2–4 week work plan
-
Gather inventory and the power scheme: from input to UPS, PDUs and separate lines. Know where measurements exist and where numbers will be calculated.
-
Specify sensors and mounting locations: which racks, at what height, how many points, and what interfaces already exist (Modbus, SNMP, dry contacts).
-
Agree a short set of pilot outcomes: a few key reports and alerts (e.g., PDU load by phase, UPS reserve, top-of-rack temperature exceedance, sensor communication loss).
-
Run the pilot and compare readings: DCIM vs UPS/PDU data and manual measurements. If discrepancies exceed 5–10%, fix the data source first, not the reports.
-
Record acceptance criteria and expansion plan: speed of adding racks, who is responsible for adding assets, how diagrams and thresholds are updated.
What counts as successful acceptance
A simple benchmark: the on-call opens one screen and knows where it’s overheating, where power is overloaded and what the next steps are.
Minimal acceptance checks:
- power accuracy and correct units;
- stable integrations (sensors aren’t dropping out regularly);
- delivery time of critical alerts and clear alarm text;
- reproducible procedures (who does what, step by step).
If the mini-DC is in a government agency or bank, run the pilot on typical workloads: virtualization hosts, storage, network. This reveals integration coverage and scaling behavior sooner.
Common mistakes in DCIM selection and deployment
A frequent disappointment is expecting the platform to magically bring order. DCIM helps you see the picture and manage processes, but it needs source data, rules and discipline.
Costly mistakes include: buying a system before cleaning up inventory and labeling; installing many sensors without agreeing thresholds and reactions (alerts become noise); not documenting procedures and escalations; expecting DCIM to fix electrical or cooling issues (it only shows risks); ignoring access roles and change auditability, which later makes it hard to understand why reports "broke."
Short example: temperature and leak sensors were connected but thresholds were too sensitive. Forty alerts came at night, the on-call muted notifications, and in the morning a real overheating due to a clogged filter was missed. The problem was not sensors but rules: what is warning vs critical and who owns each alert group.
A simple self-check: can you without DCIM quickly answer where equipment is, how it is powered, rack limits and who decides in an emergency? If answers are vague, start with inventory, roles and basic procedures, then expand integrations.
Short pre-purchase and launch checklist
This list helps filter out solutions that look good in demos but fail in operation.
Before purchase
Ask for confirmations on realistic terms, not a presentation:
- which protocols and drivers are supported (SNMP, Modbus, IPMI, etc.) specifically for your UPS, PDU, air conditioners and sensors;
- how power and capacity reports look at rack level, including peaks and trends;
- whether thresholds can be configured without complex custom work;
- whether user roles and audit logs exist.
Then ask to show a full scenario: temperature rose in one rack at night, the on-call got an alert, viewed history, recorded actions and closed the incident.
Before launch (pilot and acceptance)
In the pilot, prioritize data stability and clear alerts:
- telemetry collection without gaps and spikes, clear diagnostics if a sensor went offline or changed address;
- escalations and on-call schedules so alerts don't go "into the void";
- clear rules for closing incidents and recording steps;
- reconcile power reports with UPS/PDU and meter data.
If working with an integrator, fix acceptance criteria in advance: which sensors are connected, which reports are mandatory, which test alerts must be received.
Example: a mini-DC in an organization with critical services
Mini-DC in a hospital: 6 racks, some systems run 24/7 (registration, lab, imaging archive). A 10-minute outage causes queues and patient risk. The engineering footprint is compact but dense: UPS, rack PDUs, air conditioning, temperature and humidity sensors.
Problems appear as many small symptoms rather than one big failure. One rack overheats after lunch when virtualization load rises. Once a week a phase overload warning appears: equipment had been added gradually and power balance drifted.
DCIM links "what is where" with sensor and power readings. Per-rack views show hot spots coincide with dense servers in the middle and poor airflow. Alerts are not just "temperature high" but tied to rack, U positions and the time the rise began.
Repeatability matters. The on-call receives an alarm, opens the rack card and follows the template: confirm readings (temperature, phase loads, AC status), record start time and affected systems, perform safe actions (check airflow, move load, enable backup cooling), note the result and close incident with cause and recommendations.
A week later peak power reports show the overload matches backups and evening updates. The fix becomes clear and verifiable: redistribute two servers across racks, set PDU limits, improve cooling for the problematic rack and add a sensor on the rear door.
Next steps: turning selection into reliable operation
To keep DCIM from becoming a pretty but useless panel, start with accurate baseline data: rack and device lists, power diagram (inputs, UPS, PDU), list of sensors (temperature, humidity, leak, door) and owners for electricity, network and servers.
Choose one platform for a pilot and agree success criteria in advance. Pilot on 1–2 racks and one representative engineering circuit where both load and risk exist (for example, a rack with virtualization and UPS).
Success criteria should be verifiable in a week: sensors and PDUs provide correct readings and events aren’t lost; power reports match UPS or meter measurements; incidents are recorded, assigned and keep a clear history; there is visible capacity reserve to know what can be added safely.
After pilot create a short rollout plan, otherwise the system will quickly "die." It should formalize sensor and integration onboarding, user roles, on-call training and reference data rules (racks, assets, locations).
A simple workable regulation helps: any rack change requires a ticket and DCIM update; new equipment isn’t put into service without DCIM registration; monthly inventory and key sensor checks; and a contact list with response times for alarms including night shifts.
If you need a partner to handle full integration (hardware, infrastructure, deployment and support), consider GSE.kz as a system integrator: the company has experience building IT infrastructure and provides 24/7 technical support, which helps move DCIM to stable operations rather than just installing software.