Centralized logging: choosing Splunk, Elastic or Graylog
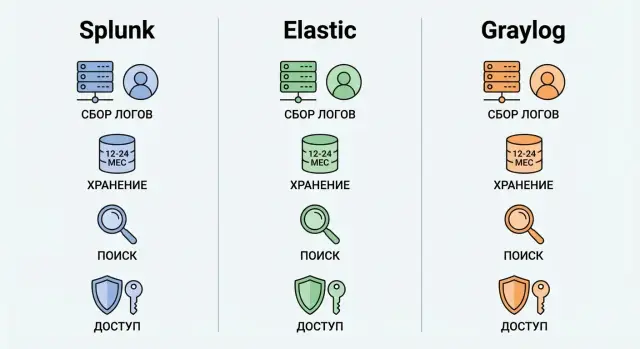
Centralized logging: a comparison of Splunk, Elastic and Graylog for collection, retention, search, access roles and storage cost over 12–24 months.
Why centralized logging is needed and what it delivers
When logs are scattered across servers, applications and network devices, investigations become a puzzle: some events are already overwritten, some are in different time zones, and some are inaccessible due to permissions. Centralized logging solves this pain: events arrive in one place, are normalized and can be searched by clear rules. This is especially important during incidents when minutes matter more than pretty reports.
In practice, the benefits usually fall into three tasks: quickly understanding what happened (incident response and investigation), proving that things are under control (audit), and spotting issues early (monitoring and alerts). With a single source of truth there are fewer disputes between teams and it’s easier to build a repeatable response process.
Systems commonly collect events from OS and virtualization, applications and databases, network (firewall, proxy, VPN, load balancers), security tools (EDR, IAM, AD, mail, SIEM events), and from clouds and SaaS if they are used.
A 12–24 month retention changes the game. The question is no longer only whether the product can search, but how much storage will cost and how to avoid surprises: volume growth, noisy sources, duplicates, immutability requirements, and recovery speed.
Before choosing Splunk, Elastic or Graylog, document a few basics: estimated daily volume and peaks, who must see what (roles, departments, contractors), mandatory retention periods and their reasons (policies, regulators), search performance requirements for "old" data, and the deployment/operations model (in-house or via an integrator).
For example, banks or government agencies often require long retention and strict access roles. That means architecture and budget should be calculated in advance, not after a pilot.
Splunk, Elastic, Graylog: how they differ in real life
When choosing centralized logging you pick more than a search UI. You pick an operational model: who will run the system, how you will control volume growth, and where the most expensive mistakes will show up in 6–12 months.
When each option is commonly chosen
In practice, choices often look like this:
- Splunk is chosen when you need predictable outcomes and strong built-in features: fast search, correlations, convenient investigation workflows, and lots of ready-made content. It’s often chosen for security and strict reporting requirements.
- Elastic (Elastic Stack) is selected when flexibility and control over architecture matter. It’s a good option if your team has operational experience and is ready to configure pipelines, index templates and data lifecycle policies.
- Graylog is often picked as a simpler route to solid collection and log management, especially when you want clear message flows, roles and alerts without complex "constructor" assembly.
License terms should be considered up front because they directly affect the 12–24 month budget. Splunk licensing often hinges on ingest (how much data you accept per day). In Elastic, key capabilities (for example, some security features and advanced management) depend on subscription level. Graylog licensing commonly varies by nodes, volume or feature sets, while storage and performance still depend on the backend (often Elasticsearch or OpenSearch).
What usually turns out to be difficult
Problems are usually not with installation but with operation:
- Splunk: rapidly increasing costs as volume grows; data filtering and routing discipline are required.
- Elastic: cluster configuration and maintenance, upgrades, and controlling mappings and search performance.
- Graylog: dependence on the quality of configured storage and limitations at very large scale.
Sometimes a combination of tools wins. For example, collect and route in Graylog, keep hot data for fast investigations in Elastic, and move old retention data to cheaper storage and bring it up only for audits. This balances convenience, search speed and storage cost.
Log collection: agents, formats, normalization and loss control
Collection is the foundation of centralized logging. If the input is "dirty," fast search and dashboards won’t save you. Start with a source map: Windows and Linux, network equipment (firewall, router, switch), business apps, databases, containers, and cloud logs.
Next decide how to deliver events. A host agent usually gives more control: local queueing, retries on network interruptions, and rate limits. Agentless methods (syslog, API, exports) are simpler but more likely to drop data during peaks if there’s no buffering. A good rule: where logs are critical for investigations (authentication, privileges, payments) you need guaranteed delivery and a clear retry policy.
Normalization and parsing are as important as delivery. Normalize timestamps and fix the timezone, otherwise events will "jump" during an investigation. Watch encodings (especially if messages contain Cyrillic), extract fields (user, host, src_ip, action) and mask sensitive data immediately (national IDs, card numbers, tokens). It’s better to lose part of a field than to have a data leak in logs.
Data quality control must be continuous. Simple checks are enough: proportion of events with parsing errors and empty fields, difference between a source’s counter and accepted volume, spikes in duplicates (identical event_id or repeated messages), delivery lag by event time, and top sources that suddenly start "noising."
How to estimate volume: take 3–7 days, calculate average events/sec and event size, then multiply by a peak factor (often 3–10x during incidents or updates) and add margin. For example, when collecting logs from domain controllers, SIEM connectors and network devices in one data center, peaks typically occur during business hours and service restarts. It’s better to see this in a pilot than to hit queue overflows and data "holes" later.
Retention 12–24 months: planning storage without surprises
Retention for 12–24 months isn’t just "keep everything two years." In practice it means tiered storage: fast data for daily work, cheaper storage for rare investigations, and archives for audits. This approach supports investigations and the budget: you pay for speed only where it’s really needed.
Usually three layers are defined. "Hot" storage keeps recent logs on fast disks so search and alerts run without delay. "Warm" storage suits regular reviews of older months. "Cold" or archive storage is for rarely accessed data required by policy or regulators.
Speed and cost depend on what you index and how you store it. Indexing speeds up search but increases size. Compression reduces size but can slow queries, especially when searching old data frequently. Decide in advance which fields are necessary for investigations (user, host, action, outcome) and which can remain raw and retrieved only when needed.
A portion of data can usually be removed from fast indexes but kept for audit. For example, detailed application debug logs are often only needed for the first 14–30 days; after that, aggregates or error events suffice. Access logs, privilege changes, admin actions and security events typically require longer retention.
To make the plan resilient, set clear rules:
- Define tiers: for example, 30 days hot, 90–180 days warm, the rest cold/archive.
- Split data by type and retention rather than storing everything the same way.
- Configure automatic deletion by age and quotas so disks don’t fill up.
- Test archive restoration in advance: who, how fast and in what format will get the data.
- Regularly review volumes: doubling in a year is more common than it seems.
A good practice is to tie retention to the value of logs. Security and admin events are often kept 12–24 months. Business-system logs that require tracing are usually kept 6–12 months. Detailed debug logs are often limited to weeks.
If you build this on your own servers and storage, agree on SLA for archive search in advance: "within 5 minutes" and "within a day" cost very differently. In integration projects where a partner handles infrastructure and support, discuss this before purchases. For example, GSE.kz as a systems integrator in Kazakhstan often helps assemble storage and operations contours to meet retention and availability requirements.
Search, reports and alerts: what matters for investigations and monitoring
When the system is ingesting events, centralized logging’s value shows in two things: how quickly you find what you need and how rarely alerts interrupt work.
For investigations you almost always need the same anchors: time, host, user, event type and the "trail" across related systems. Check how easily the selected tool can filter by these fields, link events into a chain and drill down from a broad query to details without losing context. If fields aren’t normalized (for example, a username appears in different formats), search becomes slow not by speed but by meaning.
Dashboards and reports: who and how often
Dashboards are useful only if it’s clear who opens them and what decisions they make. SOC and security look at incidents and anomalies, operations at service errors and degradation, executives at trends weekly or monthly. So practicality matters more than beauty: how quickly widgets can be edited, new sources added and old reports kept working when log formats change.
Alerts: less noise, more meaning
A good alert answers two questions: "what happened" and "what to do next." Configure thresholds and schedules so night notifications arrive only for critical scenarios, not background spikes.
For a pilot prepare 5–10 daily questions to ask of the logs and test them on real data. Examples:
- Who and from where logged into admin accounts in the last 24 hours?
- Which hosts had a spike in authentication failures, and when did it start?
- What preceded the failure of a specific service (timeline for 15 minutes before the event)?
- What configuration changes occurred on servers on the day of the incident?
- Is there a correlation between load and application errors by hour?
If these queries form clear reports and produce accurate alerts without a flood of false positives, you’re on the right track.
Access roles and security: how to avoid overexposure
In centralized logging a "leak" more often happens due to overly broad permissions than a breach. Logs often contain personal data, tokens, infrastructure details and occasionally passwords in error messages. So decide who needs to read logs and why before enabling collection of "everything."
RBAC is easier to manage when roles map to tasks. Usually 4–5 clear roles suffice: platform administrator, operations engineer (search and alerts), SOC/security (investigations), auditor (read-only and reports), and business user (prebuilt dashboards without raw access). The fewer special exceptions, the lower the risk someone will see too much.
To separate access between departments and systems use multi-tenancy or at least strict separation by indexes/projects and filters. Simple example: a bank’s card processing team should not see HR logs, and a contractor for one system should not see logs for the entire network. Verify restrictions work not only in the UI but also via API, saved queries and export.
Activity tracking and immutability
Without access logs, security is "by word." You must know who viewed data and who changed settings: sources, parsing, retention, alerts and roles. For sensitive environments WORM approaches and immutable archives are useful so events cannot be quietly deleted or rewritten retroactively.
Single sign-on and protecting data in logs
Integration with corporate authentication (SSO) reduces account chaos and speeds revocation on termination. Require MFA for critical roles. If there are separate environments (prod/test), separate them by groups and policies.
Agree in advance on where to mask sensitive data and who is responsible. Practical rules:
- Don’t log secrets when possible (fix application and configuration code).
- Mask at the agent/pipeline level if data must not reach the platform at all.
- Finish masking on the platform side if some teams still need a redacted view.
- Assign a data owner (usually the product team) and a policy owner (security).
- Regularly sample logs to check for accidental token or personal data leaks.
This way you get useful logs for investigations and monitoring without turning the system into open access to internal data.
Operations: scaling, resilience and backups
Centralized logging breaks more often from operational issues than from search or dashboards. Before choosing a platform agree on acceptable limits: how many minutes of downtime per month and how many logs can be lost during a failure (for example, 0.1% per day or "none" for security logs).
Scaling and resilience
Growth usually happens along two axes: more sources (servers, apps, network devices) and longer retention. That means higher incoming throughput, more indexes and more disk, plus higher networking and IOPS requirements.
Understand how the system scales in your model: by adding storage nodes, separate ingest nodes, or replacing servers with more powerful hardware. For government and large enterprises it’s often critical that the platform survives a single node failure without stopping ingestion or losing data. That requires input queues, replication, clustering and clear separation of component roles.
Check in advance:
- what downtime is considered acceptable and what RPO/RTO you plan for
- what happens when disks fill or network drops
- how capacity is added as EPS and retention grow
- whether the system can be maintained without stopping ingestion
- who will be on-call and what to do at 3 a.m.
Backups, upgrades and observability
Backups in logging are often confused with retention. Retention covers how long you keep data; backups are for recovery after human error, ransomware, array failure or failed upgrades. It’s important not only to make copies but to regularly test restoration in a staging environment.
Decide who maintains versions and plugins. Any platform accrues parsers, integrations and alert rules over time. Upgrades should be planned with maintenance windows and rollback plans.
Minimum observability for the logging system itself:
- ingest queue and share of dropped events
- indexing lag (how many minutes search is behind)
- disk fill and growth rate
- CPU/RAM load and service errors
- alerts on "quiet" sources (suddenly stopped sending)
Large organizations benefit from a partner who can build a resilient contour and provide 24/7 support. If relevant, that model is often delivered by system integrators with their own service network, for example GSE.kz.
Cost over 12–24 months: how to budget without guessing
Logging budgets almost always "drift" due to two reasons: underestimated data volume and forgotten people costs. For an honest estimate calculate TCO (total cost of ownership) for 12–24 months and fix your assumptions.
TCO commonly consists of five blocks: licenses and subscriptions (by ingest, nodes, features, support), infrastructure (servers, disks, network, backup, power), storage (indexes, replicas, hot/warm/cold layers, archive), people (implementation, maintenance, on-call, response) and training/development (parsing, dashboards, alert rules, documentation).
The clearest part is storage. Start with the basic formula:
Volume_for_period = GB_per_day x days x compression_factor x (1 + index_overhead) x replication_factor.
Example: 200 GB/day, retention 365 days. If after compression and optimization you keep 0.6, index overhead is 20% (1.2), and replication is 2, then: 200 x 365 x 0.6 x 1.2 x 2 ≈ 105,120 GB, about 105 TB of disks just for storage. If you need fast search for 30–90 days, part of that volume must sit on more expensive fast disks.
Next compare deployment scenarios. On-prem is often cheaper for traffic and gives more control, but requires capital for servers and spare disks. Cloud is easier to start and scale, but ingest and storage bills can grow quietly and sometimes include egress charges. Hybrid is often a sensible compromise: hot data nearby for investigations, archive cheaper elsewhere.
Less obvious costs are parsing and normalization work, fixing noisy sources, agent maintenance, upgrades and team training. Add a 30–50% buffer for log growth, new systems and seasonal peaks. This is usually cheaper than urgently buying disks and reworking a cluster.
If planning on-prem, estimate the hardware required: long-retention often needs dedicated storage nodes. In Kazakhstan such projects are often built on locally produced servers, and integrators handle implementation and support so rare expertise doesn’t have to be kept in-house.
How to choose step by step: requirements, pilot and success criteria
Start the selection with goals, not a brand. One thing is quickly handling incidents, another is meeting audit requirements, and another is building monitoring with alerts. If you mix goals you’ll end up with an expensive platform used only occasionally.
First, record the promises you give the business (SLA): how many minutes to find key events, acceptable downtime, who gets night notifications, and what counts as "lost logs." For government and financial organizations in Kazakhstan, verifiable storage and access processes are often required.
Then collect data facts. Don’t estimate volumes by eye: collect at least 7–14 days of real logs from main sources (AD, VPN, EDR, servers, apps, network gear). Mark peaks separately (month-end, mass updates, incidents).
Next define retention and storage tiers: what must be available for fast search and what can be moved to cheaper tiers with slower retrieval. At the same time agree roles: SOC, admins, development, audit. Also document 10–15 typical queries (who did what and when; login chains; suspicious connections) and which fields are mandatory for them.
What to validate in a pilot
A pilot should answer contentious questions with numbers, not opinions. Verify:
- search speed on hot data and on archive
- resilience to peak loads and losses when agents/network fail
- normalization quality: do fields match across sources
- access segregation and user action logging
- effort: how long to add a new source and support dashboards
Finally, approve a support model: who administers the platform and who owns content (parsers, rules, alerts, reports). For example, an integrator like GSE.kz can cover infrastructure and 24/7 support while the internal team owns detection rules and investigation scenarios.
Common implementation mistakes and how to avoid them
The most expensive mistake is buying licenses before understanding real data volumes. A pilot almost always "fits everything," but in production bills for storage and licensing grow because of retention and event peaks.
Another frequent problem is "collecting everything." Teams quickly drown in noise: searches become burdensome, alerts fire constantly, and useful traces are lost among repetitive messages.
Mistake -> do this instead
- Estimate volumes by eye -> measure daily flow by source and lock target retention (12 or 24 months) before purchase.
- Collect all events -> create selection rules: what to store long-term, what to aggregate, what to drop, and review after initial investigations.
- Postpone access roles -> define RBAC up front: who sees prod, who sees personal data, who can change pipelines and alerts.
- Not testing recovery -> run planned failure tests (node loss, disk full, restore from backup) and document steps.
- Creating alerts "to nowhere" -> every alert must have an owner, a response window and a clear action.
Imagine a bank or medical organization enabling collection from all workstations, servers and network devices without filtering. After a month storage consumes the budget and all admins including contractors gain access to logs. This isn’t a problem with Splunk, Elastic or Graylog specifically. It’s a problem of requirements and process.
Good practice: first define which investigations you actually perform (accounts, access, changes, network anomalies) and configure sources, fields and retention for them. If deploying on your infrastructure, add operational responsibilities to the plan: who handles upgrades, capacity and backup checks.
Checklist and next steps: from pilot to production
To avoid a choice based on impressions, collect requirements on one page. For centralized logging this is crucial: everything depends on sources, volumes and how quickly you must find an event.
You should have answers to basic questions: which sources you connect first and the expected daily volume in GB or events; retention (how long hot search is kept and how long the archive is kept for 12–24 months); critical investigation scenarios (by user, host, service, chain); required access roles and who can export; acceptable SLA for downtime and response; and budget for storage and support.
Next, run a short pilot that shows real value and real cost. Agree on a small set of checks in advance and use them as an exam.
Minimum pilot tests:
- 10 search queries from your real cases (incidents, errors, logins, config changes)
- 5 dashboards for different roles (SOC, admins, service owners)
- 5 alerts with thresholds and noise suppression (to avoid hundreds of false positives)
- loss test: artificially overload a source and verify drops and queues are visible
- node-failure test: shut down a component and check system recovery
For procurement and deployment prepare numbers: required CPU and RAM for indexing and search, volume and disk types for hot and cold storage, network requirements (bandwidth, segmentation, ports), and a backup and restore plan.
Implementation usually goes in stages: start with 2–3 key sources and basic roles, then expand to other systems, and only then optimize retention. Often within 4–8 weeks you see which logs can be compressed, aggregated or moved to cheaper storage.
If you need a full turnkey contour, involve a systems integrator to cover infrastructure, deployment and 24/7 support. In Kazakhstan such environments are often built on GSE-produced servers and designed for growth and resilience requirements.
FAQ
Why do we need centralized logging if logs are already on the servers?
If logs are spread across different servers and devices, incident investigation takes time to gather and correlate events. Centralized logging brings events into one place, normalizes their format and timestamps, and provides fast search. The result is easier investigations, smoother audits and the ability to build monitoring with meaningful alerts.
Which log sources should be connected first?
To start, authentication and authorization logs (AD/IAM, VPN), events from critical servers and business applications, and network logs (firewall, proxy) are usually enough. These sources are most often needed in investigations and deliver the greatest value with a minimal volume. Connect other systems as parsing, access roles and storage budget allow.
How to choose between Splunk, Elastic and Graylog in a nutshell?
Splunk is often chosen when you need out-of-the-box investigation tools, fast search and a lot of prebuilt content—especially for security and compliance. Elastic fits when you need flexibility and your team can operate a cluster and manage data schemas. Graylog is frequently selected when you want straightforward collection, message flows, roles and alerts without heavy assembly—but scale and storage costs still depend on the chosen backend.
Why does logging cost usually spike after six months?
The main cost drivers are how much data you ingest per day and how many months you store it, plus replication and indexing overhead. Even a small increase in noisy sources can raise license and disk costs significantly. Measure the real data flow first and agree which data to retain, aggregate or drop.
How to plan log retention for 12–24 months correctly?
A 12–24 month retention needs tiered storage: a fast layer for recent data and cheaper layers for older data. This way you don’t overpay for speed where searches are rarely needed but retention is mandatory. Also agree in advance how quickly archived data should be restored—expectations and budget diverge if that isn’t defined.
Which is better for log collection: agents or agentless (syslog/API)?
An agent on the host is usually more reliable: it provides a local queue, retries and rate control, so fewer events are lost during peaks or network issues. Agentless options are simpler to deploy but more likely to drop events without buffering. For critical logs (auth, privileges, payments) prefer delivery with clear retries and queuing.
What is the minimum normalization needed to make search genuinely useful?
Start with a unified timestamp and timezone, otherwise timelines break during investigations. Then extract basic fields like user, host, source, action and result so queries work uniformly across systems. Decide in parallel where to mask sensitive data so such information doesn’t reach the platform in raw form.
How can I tell if logs are being lost or arriving late?
Look at the share of events with parsing errors, delivery lag by event time, and the difference between what the source sent and what the platform received. Also track sudden spikes of duplicates and noisy sources that clog queues. These metrics show quickly where data gaps appear and why alerts become unreliable.
How to set access to logs so contractors and other teams don’t see too much?
Create roles by task and keep them simple: platform administrator, operations engineer, SOC/security, auditor (read-only and reports) and dashboard users. Separate access by indexes or projects and verify restrictions work not only in the UI but also via API and export. Logs often contain personal data and secrets, so limit visibility early and enable user activity audit within the platform.
What must be tested in a pilot so you don’t have to redo everything in production?
The pilot must verify numbers, not impressions: can the system handle peaks, how fast is search across hot and archived data, and how long does it take to add a source with proper parsing. Also test failure scenarios and recovery to understand real RPO/RTO. If you need a turnkey model with infrastructure, resilience and 24/7 support, that’s typically provided by a systems integrator; in Kazakhstan such projects, including server selection and operational design, are offered by GSE.kz.