BI Layer in a Business System: Data Marts, Caching and Updates Without Overload
How to add a BI layer to your business system: data marts, caching, update schedules and access control so reports don't slow down OLTP.
Why reports start to "bring down" the transactional database
The transactional database (OLTP) is built for short operations: post a document, find a customer, update stock. When heavy reports run during business hours against the same system, they compete for the same resources: CPU, memory, disk, cache, locks and connections. As a result, staff see a simple picture: document posting slows down, searches "think", and sometimes the system becomes unresponsive.
This often starts quietly. At first a single "annual sales" report runs once a week, then it’s moved into a daily routine. Managers may open dashboards at roughly the same time, for example in the morning. At peaks these loads add up and hit the most sensitive operations.
Common symptoms repeat:
- the user interface responds slower even though "nothing changed"
- long queries and wait queues appear in the database
- locks grow: some operations wait for others
- CPU stays close to max, disks are busy almost constantly
- the scheduler and connection pool get saturated, new requests wait for a slot
Direct BI access to the transactional database is particularly risky. Analytics rarely limit themselves to a narrow period or a single table. A BI tool can generate complex queries with joins, sorts and groupings, and users run them in parallel. Even "read-only" activity interferes with writes due to locks, resource contention and pressure on cache.
A real-life example: accounting posts many documents at the end of the day while managers open an accounts receivable report with breakdowns by counterparty and contracts. The report scans a large volume of data, the database reads more from disk, and document posting slows down for everyone.
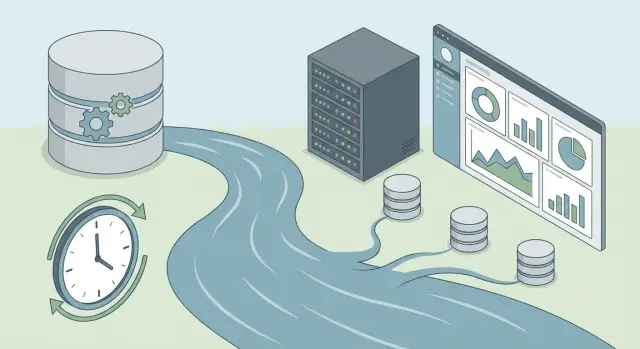
This is where a BI layer in a business system is needed: separate analytics from operations. It usually has four goals: fast reports, stable OLTP operation, predictable load (by schedule and windows), and controlled access so everyone sees only what they should.
What the right scheme looks like: OLTP separate, analytics separate
OLTP is the transactional circuit. It’s needed to record operations quickly and reliably: sales, requests, payments, warehouse movements. The main priority is stability and predictable response time for each short operation.
The analytical circuit solves a different task: heavy selections, period comparisons, trends, marts for different departments. Mixing these loads in one database makes reports compete with transactions for CPU, memory and disk.
Therefore the BI layer is typically built as a separate chain so reports don’t hit the production transactional database directly:
data sources (OLTP and other systems) -> staging (intermediate zone) -> data marts (models built for business questions) -> BI tool.
Staging is needed to carefully pull data from sources, normalize it and keep a raw snapshot. It’s also a convenient place for basic data-quality checks: missing values, duplicates, unexpected values.
Data marts are where calculation logic lives. Put rules there: how to calculate revenue, margin, debt, SLA, funnels, active users. Then a metric is identical across reports and reports remain simple and fast.
Keeping calculations "inside the report" causes two problems. First, load grows every time a dashboard opens. Second, metric definitions diverge between teams. It’s simpler to compute once in a mart and show it safely many times.
Example: finance builds a yearly payments report broken down by branches and accounts. If BI recalculates this in OLTP every time, users will see slowdowns and the system will struggle at peak hours. Preparing a mart with the needed slices and updating it on a schedule keeps OLTP for operations and makes the report open fast.
The effect of this scheme is measured not by architectural beauty but by numbers. Important: report response time (for typical dashboards, 2–5 seconds), SLA for updates (for example hourly with up to 10 minutes delay), no analytics-driven peaks on OLTP, and unified metric definitions.
Data marts: types and how not to overcomplicate
A data mart is a prepared set of tables for reporting and analytics. It’s not a "copy of the DB": data is cleaned, joined, has clear fields and stable calculation rules. In the BI layer a mart helps reports run fast and predictably, without treating transactional tables like "just another ERP user".
The main choice that defines mart complexity is the level of detail. The more granular the data, the larger the volume and the easier it is to accidentally produce a heavy report.
A manager often needs metrics by day and department (revenue, margin, balances). An analyst investigating warehouse losses may need operation-level detail (receipt, transfer, write-off) and events (inventory, regrading). A practical compromise: keep the "source of truth" at a more detailed level and build separate aggregates only for the most popular slices.
Structurally a star schema is often enough: a fact table (sales, movements, accruals) and several dimensions (customer, product, department, date). A snowflake fits complex hierarchies but often only complicates maintenance and makes queries heavier.
To avoid marts turning into chaos, group them by domain and keep clear boundaries: sales & marketing, finance, warehouse & logistics, HR.
A separate discipline is unified reference data and naming rules. If "customer" in one mart means counterparty and in another means branch, you will get different numbers in adjacent reports.
A short set of rules usually helps:
- unified keys and names for basic entities (customer, product, department)
- a single date dimension and a single org-structure dimension
- clear prefixes/suffixes (e.g., fact_ for facts and dim_ for dimensions)
- fixed metric definitions (what counts as "sale", how "margin" is calculated)
- a simple catalog of marts: owner, purpose, refresh frequency, users
This keeps marts explainable, extensible and less vulnerable to accidental heavy queries.
Loading data: staging, increments and quality control
To prevent reports from suffocating the transactional database, extract data for analytics separately and place it into an intermediate layer. Then BI reads prepared tables instead of touching production operations.
Why a staging layer is needed
Staging is a buffer between OLTP and marts. Raw extracts land there with minimal transformations. This reduces OLTP load (a short extract instead of heavy queries) and provides a place to validate and fix data without breaking marts.
Example: accounting closes the day while managers view sales. If BI reads OLTP directly, any complex report can slow document posting. If extracts go to staging at night or in small batches, reports read from marts and do not interfere with accounting.
Incremental load, full reload and CDC
Full reloads are simple but usually expensive: you move everything each time, increasing maintenance windows and risk. Incremental loading is typically better: you pull only what changed and update marts faster.
Mechanisms that help identify changes include: a change timestamp (updated_at), a row version counter (row_version), an event journal, CDC on the database or via the transaction log, and sometimes a row hash to detect actual changes.
The choice depends on the system. If OLTP lacks reliable change markers, staging helps: you can take snapshots of keys and dates and then fetch details.
Quality control and load logs
Errors surface fastest in reports, but fixing them there is costly. So checks should run before marts update: detect duplicates by business keys, check for missing required fields, validate referential integrity, ranges and formats (dates, amounts, tax IDs), compare checksums and row counts with the source.
Keep load logs to troubleshoot failures without guessing. Minimum: what was loaded (source, table, period), start and end times, how many rows read/inserted/updated/rejected, reason for rejection and sample errors, pipeline version and run identifier (run_id).
This makes loads predictable: OLTP receives short, controlled accesses and BI works on stable marts.
Caching and pre-calculations: how to speed reports safely
Cache and pre-calculations ensure most report queries don't read "live" tables or recompute the same things repeatedly. But cache can harm if it returns stale numbers or, worse, data for the wrong role.
BI-level cache works well when users open the same dashboards and data is updated on a schedule (hourly or nightly). It’s less suitable for reports with heavy filters and rare ad-hoc queries: caches balloon and freshness becomes unpredictable.
Pre-aggregations help where there are popular metrics and recurring slices: daily sales, stock balances by warehouse, requests by status. The idea is simple: compute the aggregate once and store it so the report reads ready-made numbers. For example, if finance views P&L daily by department and project, keep a table "day - department - project - amount" instead of joining dozens of tables every time.
Materialized views are useful when logic is conveniently expressed as a query and the DB can manage refreshes. Summary tables are easier to control manually: you decide when and how to recalc and incremental updates are simpler to debug. In practice teams often start with summary tables and add materialized views selectively.
To prevent cache from creating "false truth", set freshness rules:
- TTL (time to live) per report
- invalidate on event: a mart updated -> drop caches for related reports
- mart versioning: a report reads a confirmed version while a new one is still loading
- separate caches by roles and filters if row-level security is enabled
The last point is critical. If BI enforces row-level security (by department, region), cache must consider role and filters. Otherwise you can accidentally expose another department’s data. In strict environments (government, finance, healthcare) add audit logs: who opened a report, which filters were applied and which mart version was visible.
Update schedules: frequencies, windows and SLA control
Update schedules are an agreement between the business and IT: when BI data is considered current and what happens if a load is delayed. A good schedule protects the transactional system and makes reports predictable.
Set refresh frequency by data type, not "everyone hourly." A common approach: reference data once a day or on change; operations (orders, shipments, payments) incrementally every 15–60 minutes without heavy recalculations; summaries and KPIs once a day, usually at night; an executive mart with a fixed frequency and strict deadline so numbers don’t jump.
Plan update windows so heavy steps run outside peaks. Full recalculations and reconciliations are convenient at night; daytime should only run increments. Near-real-time makes sense only where decisions are made "right now" (e.g., shipment status control) and sources tolerate frequent reads.
Document job order, dependencies, retries and deadlines. Typical chain: load into staging -> quality checks -> update marts -> pre-calculations for reports. Retries should be time-limited so they don’t chase the entire day and cause a cascade.
Have a failure plan. If a refresh is late, BI should honestly show "data current as of 10:00." For critical dashboards it’s better to fall back to yesterday’s totals than silently mix new operations with old aggregates and present incorrect figures.
Monitoring is part of the SLA. Minimum useful metrics: lag relative to schedule and completion time, volumes (rows loaded and rejected), anomalies (empty loads, sudden jumps in sums, duplicates), notification rules and run history.
A practical guideline: if reports on sales and warehouse must be ready by 9:00, finish nightly recalculations by 8:30 and update only new operations during the day. Managers see stable morning KPIs and operations teams get fresh statuses without extra OLTP load.
Access control: roles, rows, fields and audit
The BI layer quickly becomes a "common window" to data. If access isn’t planned, people see too much and in an incident it’s unclear who viewed or exported what. Define access rules before reports become daily work.
Start with a role model. It’s easier to think in task types: manager, analyst, accounting, sales, security, support. For each role define accessible marts and necessary fields. Fewer exceptions mean less manual work and lower risk.
Next, implement row-level access: the same report shown to everyone but filtered by department, region, branch, project or segment. Simple example: managers see their deals, regional directors see their region, central office sees everything.
For personal and sensitive data add field-level restrictions. Commonly hidden fields: tax IDs, phone numbers, addresses, salaries, medical data. Approaches: masking (show part of the value), pseudonymization (replace with an identifier) or returning aggregates instead of details. In government, finance and healthcare projects this is essential: a mart must not make data more accessible than the source system.
Separate duties. One person should not both modify a mart, grant rights and approve report correctness. At minimum separate mart development, platform administration and permissions, a business data owner, security and report viewers.
Finally, audit. Keep a log of actions: logins, report views, exports, permission changes, publishing new versions. This helps investigate incidents, detect leaks and understand which reports are actually used and which can be simplified or removed.
Step-by-step plan to implement a BI layer in an existing system
If reports read directly from the transactional database, they compete with live operations: payments, patient records, request processing. Implement the BI layer in stages, starting with the most useful and heaviest parts.
Implementation plan
-
Inventory reports and queries. List what is actually used and separately note the 5–10 slowest queries (by time, row count, locks). These usually cause the majority of problems.
-
Fix metrics and definitions. Agree on what "revenue", "active customer", "overdue" and "balance" mean. Document calculation rules and field sources. A couple of alignment meetings at the start save weeks of disputes later.
-
Design 1–2 marts for frequent scenarios. Don’t try to cover everything at once. Pick reports that managers open most often and those that stress the database. Keep the mart simple: clear tables, minimal joins, business-friendly fields.
-
Set up loads and checks. Build a staging layer, then load marts. Start with incremental loads and add tests: sum reconciliation, row counts, gaps by date. Decide who signs off on correctness: business or analyst.
-
Add acceleration and operational rules. Use caching and pre-aggregations only where they make an impact (top 5 reports). Then finalize refresh schedules, access control and monitoring: who sees what data, when marts update, what counts as a failure and how to change things safely.
Example: finance opens a yearly payments report every Monday that "brings down" the system. Move it to a mart with daily aggregates, refresh it overnight and restrict access to relevant departments. OLTP stays for operations and reports become predictable.
Common mistakes and pitfalls when implementing marts and cache
The most common mistake is trying to make "one big mart for everything." That seems convenient at first but the mart quickly grows. Conflicting rules are added, recalculation takes longer, and maintenance becomes expensive.
Second trap: keep business logic inside reports. When formulas, filters and exceptions live separately in each dashboard you lose unified definitions. One report calculates margin "by payment", another "by shipment", and both look plausible. Better to move calculations into the data layer: a mart or a semantic layer where formulas are visible, reusable and testable.
Another problem is updating everything too often without understanding the cost. "Every 5 minutes" usually ends with windows overlapping working hours and caches constantly invalidating. Frequency should match decisions: near-online where needed (requests), and nightly where sufficient (finance, HR). Count the cost: source load, recalculation time, storage needs.
People often underestimate reference data and keys. Without stable identifiers and matching rules (branch renamed, counterparty changed tax ID, product duplicated after migration) numbers will diverge. A mart should explicitly store keys, change history and deduplication rules.
A dangerous habit is giving BI direct OLTP access "temporarily." This typically becomes a permanent workaround: reports grow, queries get complex and load becomes unpredictable. Even with stronger hardware, architectural separation between analytics and transactions remains the basic protection.
One more common failure: no versioning and no metric documentation. Without a dictionary and change history any adjustment becomes an argument "it used to be different." At minimum record definition, metric owner, formula, effective period and reason for change.
Quick checklist and next steps
Quick check that the BI layer doesn’t harm transactions:
- reports and dashboards do not query OLTP directly (except rare diagnostic queries in a separate window)
- popular reports have marts, and recurring metrics have pre-aggregations
- updates run on a schedule agreed with the business and each dataset has an SLA
- access is role-based, with RLS and field restrictions where needed, and audit enabled
- there is monitoring for data freshness and job failures, plus a clear incident plan
If at least two items are not met, reports usually start leaking back into the production database and slow operations again.
Next steps to consolidate the result
Start with a pilot in one domain, for example "Sales" or "Warehouse." Pick 3–5 most used reports and make them fast, predictable and secure.
Then keep the same routine: data owners and metric rules, incremental updates and quality control, load and capacity checks over 6–12 months, then scale to other domains.
If you need a practical second opinion on architecture and implementation, integrators are often useful: they can cover both platform (marts, access, monitoring) and infrastructure. For example, GSE.kz (gse.kz) provides system integration and supplies servers and workstations of their own production, which is convenient when the BI contour needs to be deployed on predictable hardware with support from a single team.
FAQ
Why can reports "take down" the transactional (OLTP) database even if they only read?
If reports read the same tables as transactions, they start competing for CPU, memory, disk, cache and connections. In addition, locks and wait queues appear, so even short transactions begin to stall.
What signs show that analytics interfere with OLTP?
You usually notice slower UI response with no obvious system changes, an increase in long-running queries and waits, and a growth in locks. CPU often runs near maximum, disks are busy continuously, and new requests queue because the connection pool is full.
Why is connecting BI directly to OLTP considered risky?
Because BI tools often generate complex queries with joins, sorts and aggregations, and users run them in parallel. Even reading pressures the cache and resources, and in some scenarios causes locks that slow down writes.
What does the correct architecture look like: OLTP separate, analytics separate?
Basic scheme: data sources (including OLTP) are unloaded to *staging*, then transformed and loaded into data marts, and BI reads the marts. This separates heavy queries from the production database and makes the load predictable by schedule.
Why is a staging layer needed and what is stored there?
Staging is an intermediate layer for raw extracts with minimal transformations. It helps make short, controlled accesses to OLTP and allows data quality checks and fixes before data reaches marts and reports.
What is a data mart and how is it different from a "copy of the database"?
A data mart is prepared tables for specific business questions, with rules and clear fields already applied. It helps reports run fast and ensures the same calculations are used consistently, instead of recalculating everything each time a dashboard opens.
How not to overcomplicate marts and which model to choose?
Start with a star schema: one fact table and several dimensions (date, customer, product, department). Don’t try to make one huge mart for everything; better to build 1–2 marts for frequent scenarios and separate aggregates for popular slices to avoid bloat and complexity.
How to choose between full load, increments and CDC?
By default, incremental loading is preferable: you extract only changes and update marts faster without increasing maintenance windows. Full reloads suit only small volumes or rare rebuilds. To identify changes use updated_at, row versions, event logs, CDC or row hashes.
When to use caching and pre-calculation so you don't get "wrong numbers"?
Cache is useful for recurring dashboards updated on a schedule, and pre-aggregations for popular metrics and slices so you don't recompute the same things. Set freshness rules (TTL, cache invalidation when marts update) and separate caches by role/filters when row-level security is used.
How to set update schedules and access control in the BI layer?
Set frequency by data meaning: reference data less often, operations as increments, KPIs and heavy totals usually overnight. For access use roles, RLS if needed, and field-level restrictions for sensitive data. Also enable auditing so you can see who viewed or exported what.